Included Components
The default Reniway infrastructure v2 stack includes more than just the main Reniway application.
By default, the stack gives you a practical edge data platform with:
- the Reniway Edge application
- PostgreSQL with TimescaleDB for storage
- DBGate for database administration
- Grafana for dashboards and visualization
Default stack components
Reniway Edge
This is the main application where you configure:
- field connectors
- enterprise connectors
- data mappers
- flows
- OPC UA server
Typical access URL:
https://[HOST]
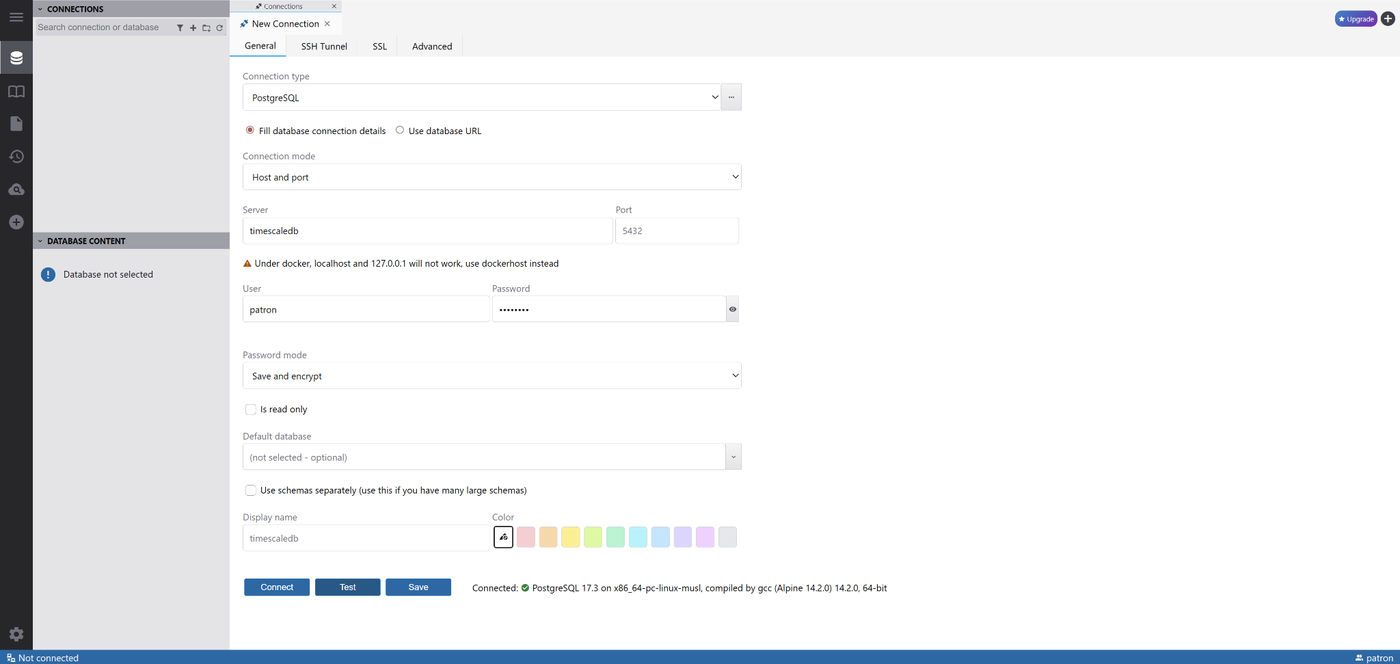
PostgreSQL with TimescaleDB
The recommended default storage layer is PostgreSQL with TimescaleDB.
This is the recommended database backend for storing machine data, calculated values, and time-series history before building dashboards.
Within the stack, the database service is typically available as:
Host: timescaledb
Port: 5432
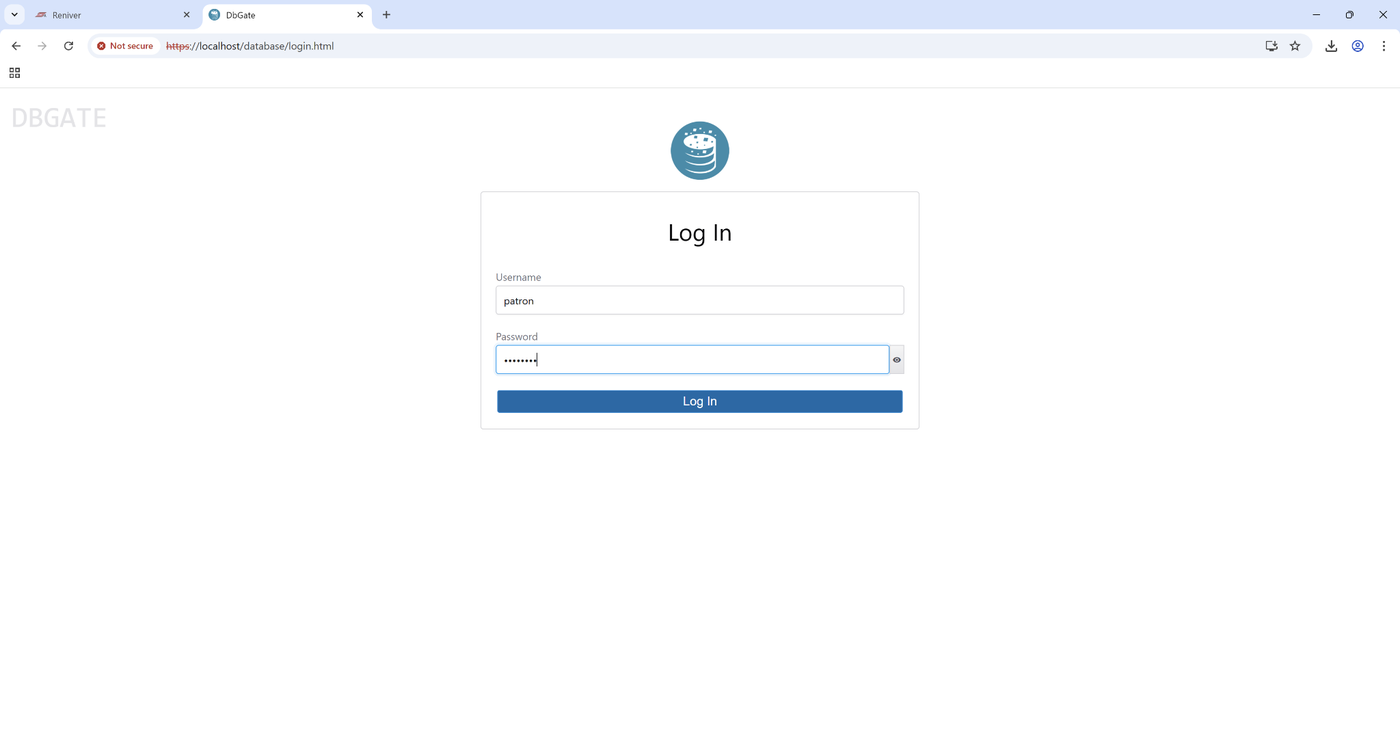
DBGate
DBGate is included as a web-based database management tool.
Use it to:
- connect to the bundled PostgreSQL / TimescaleDB instance
- create databases and tables
- inspect incoming data
- run SQL queries for validation
Typical access URL:
https://[HOST]/database
Example DBGate login:
Grafana
Grafana is included for dashboarding and visualization.
Use it to:
- connect to PostgreSQL / TimescaleDB as a data source
- build operator dashboards
- visualize machine state, counters, temperatures, KPIs, and trends
Typical access URL:
https://[HOST]/dashboards
Recommended workflow
The recommended workflow is:
- collect machine data in Reniway Edge
- write the data to PostgreSQL with TimescaleDB
- inspect and validate the stored data with DBGate
- connect Grafana to PostgreSQL
- build dashboards on top of the stored time-series data
This approach keeps acquisition, storage, validation, and visualization clearly separated.
Why PostgreSQL with TimescaleDB is recommended
PostgreSQL with TimescaleDB is the recommended storage path because it fits the typical Reniway use case well:
- structured SQL storage
- efficient handling of time-series data
- easy validation through DBGate
- direct integration with Grafana
For most operational dashboards and machine monitoring projects, this is the most practical default architecture.
Example: from Reniway to dashboard
In a typical project, a field connector reads machine data, an enterprise SQL connector writes it into PostgreSQL / TimescaleDB, and Grafana reads it back for dashboards.
1. Validate database access in DBGate
DBGate can be used to create or inspect the target database and tables.
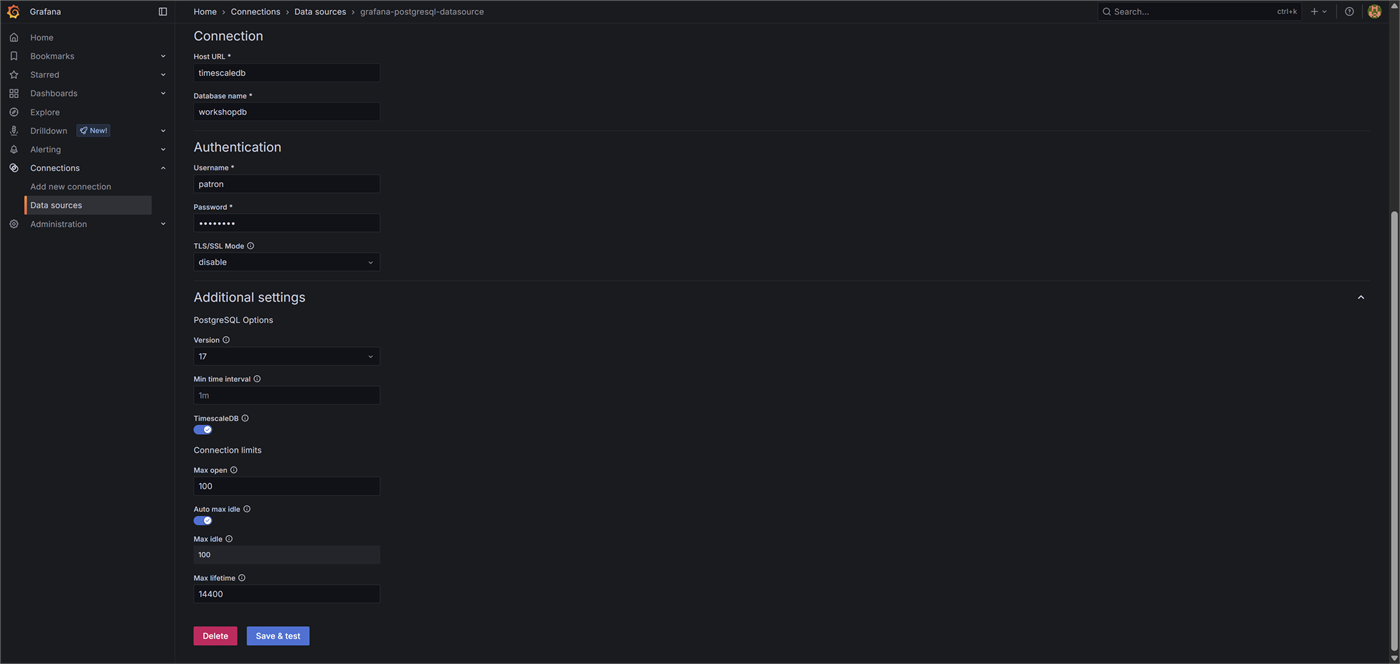
2. Connect Grafana to PostgreSQL
In Grafana, add PostgreSQL as the data source using the same database details as the Reniway SQL connector.
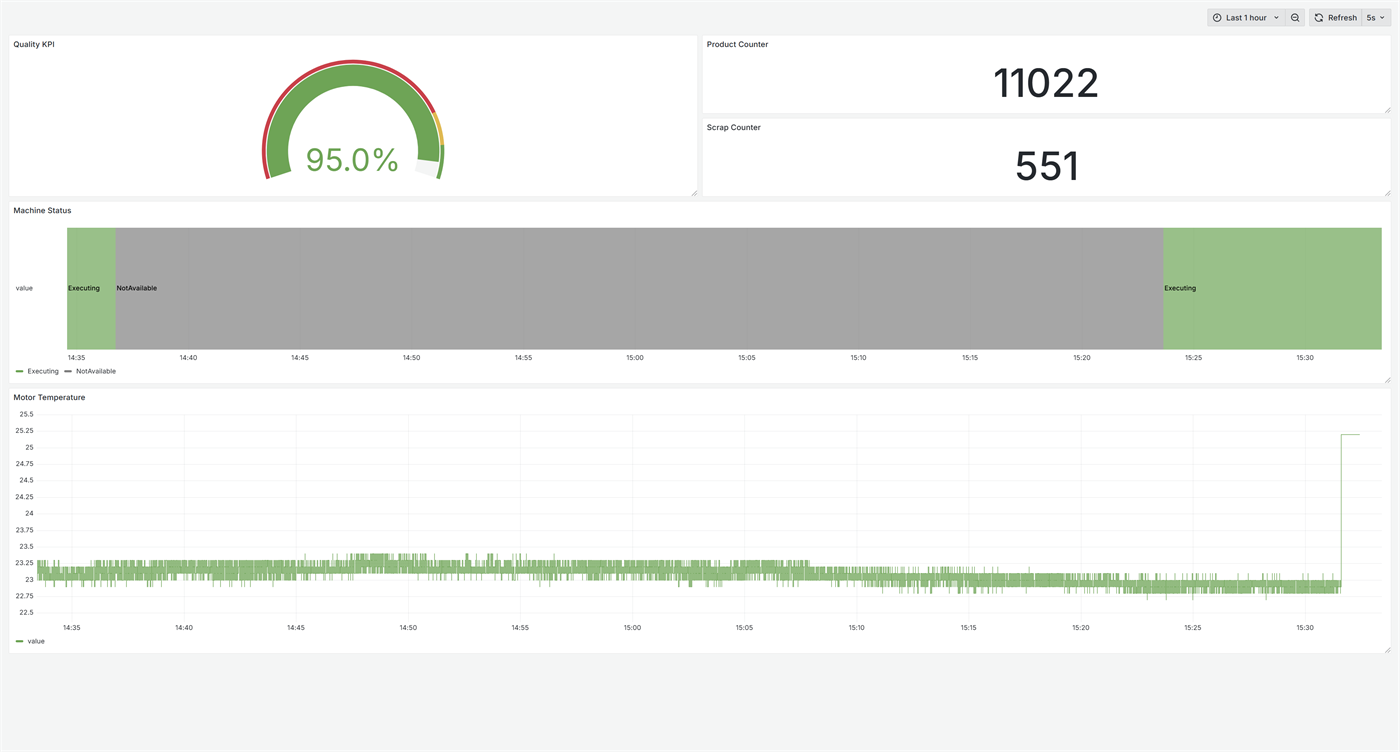
3. Build dashboards
Once the data source is connected, build dashboards with time series, state timelines, counters, and KPIs.
Access summary
| Component | Purpose | Typical access |
|---|---|---|
| Reniway Edge | Configuration and orchestration | https://[HOST] |
| DBGate | Database management | https://[HOST]/database |
| Grafana | Dashboards and visualization | https://[HOST]/dashboards |
| PostgreSQL / TimescaleDB | Data storage | timescaledb:5432 |