Realtime Logging
The Logs button in the top-right header opens the realtime logging window. This is the fastest way to see what Reniway Edge is doing while you are configuring connectors, testing flows, or validating a deployment.
What the logging window shows
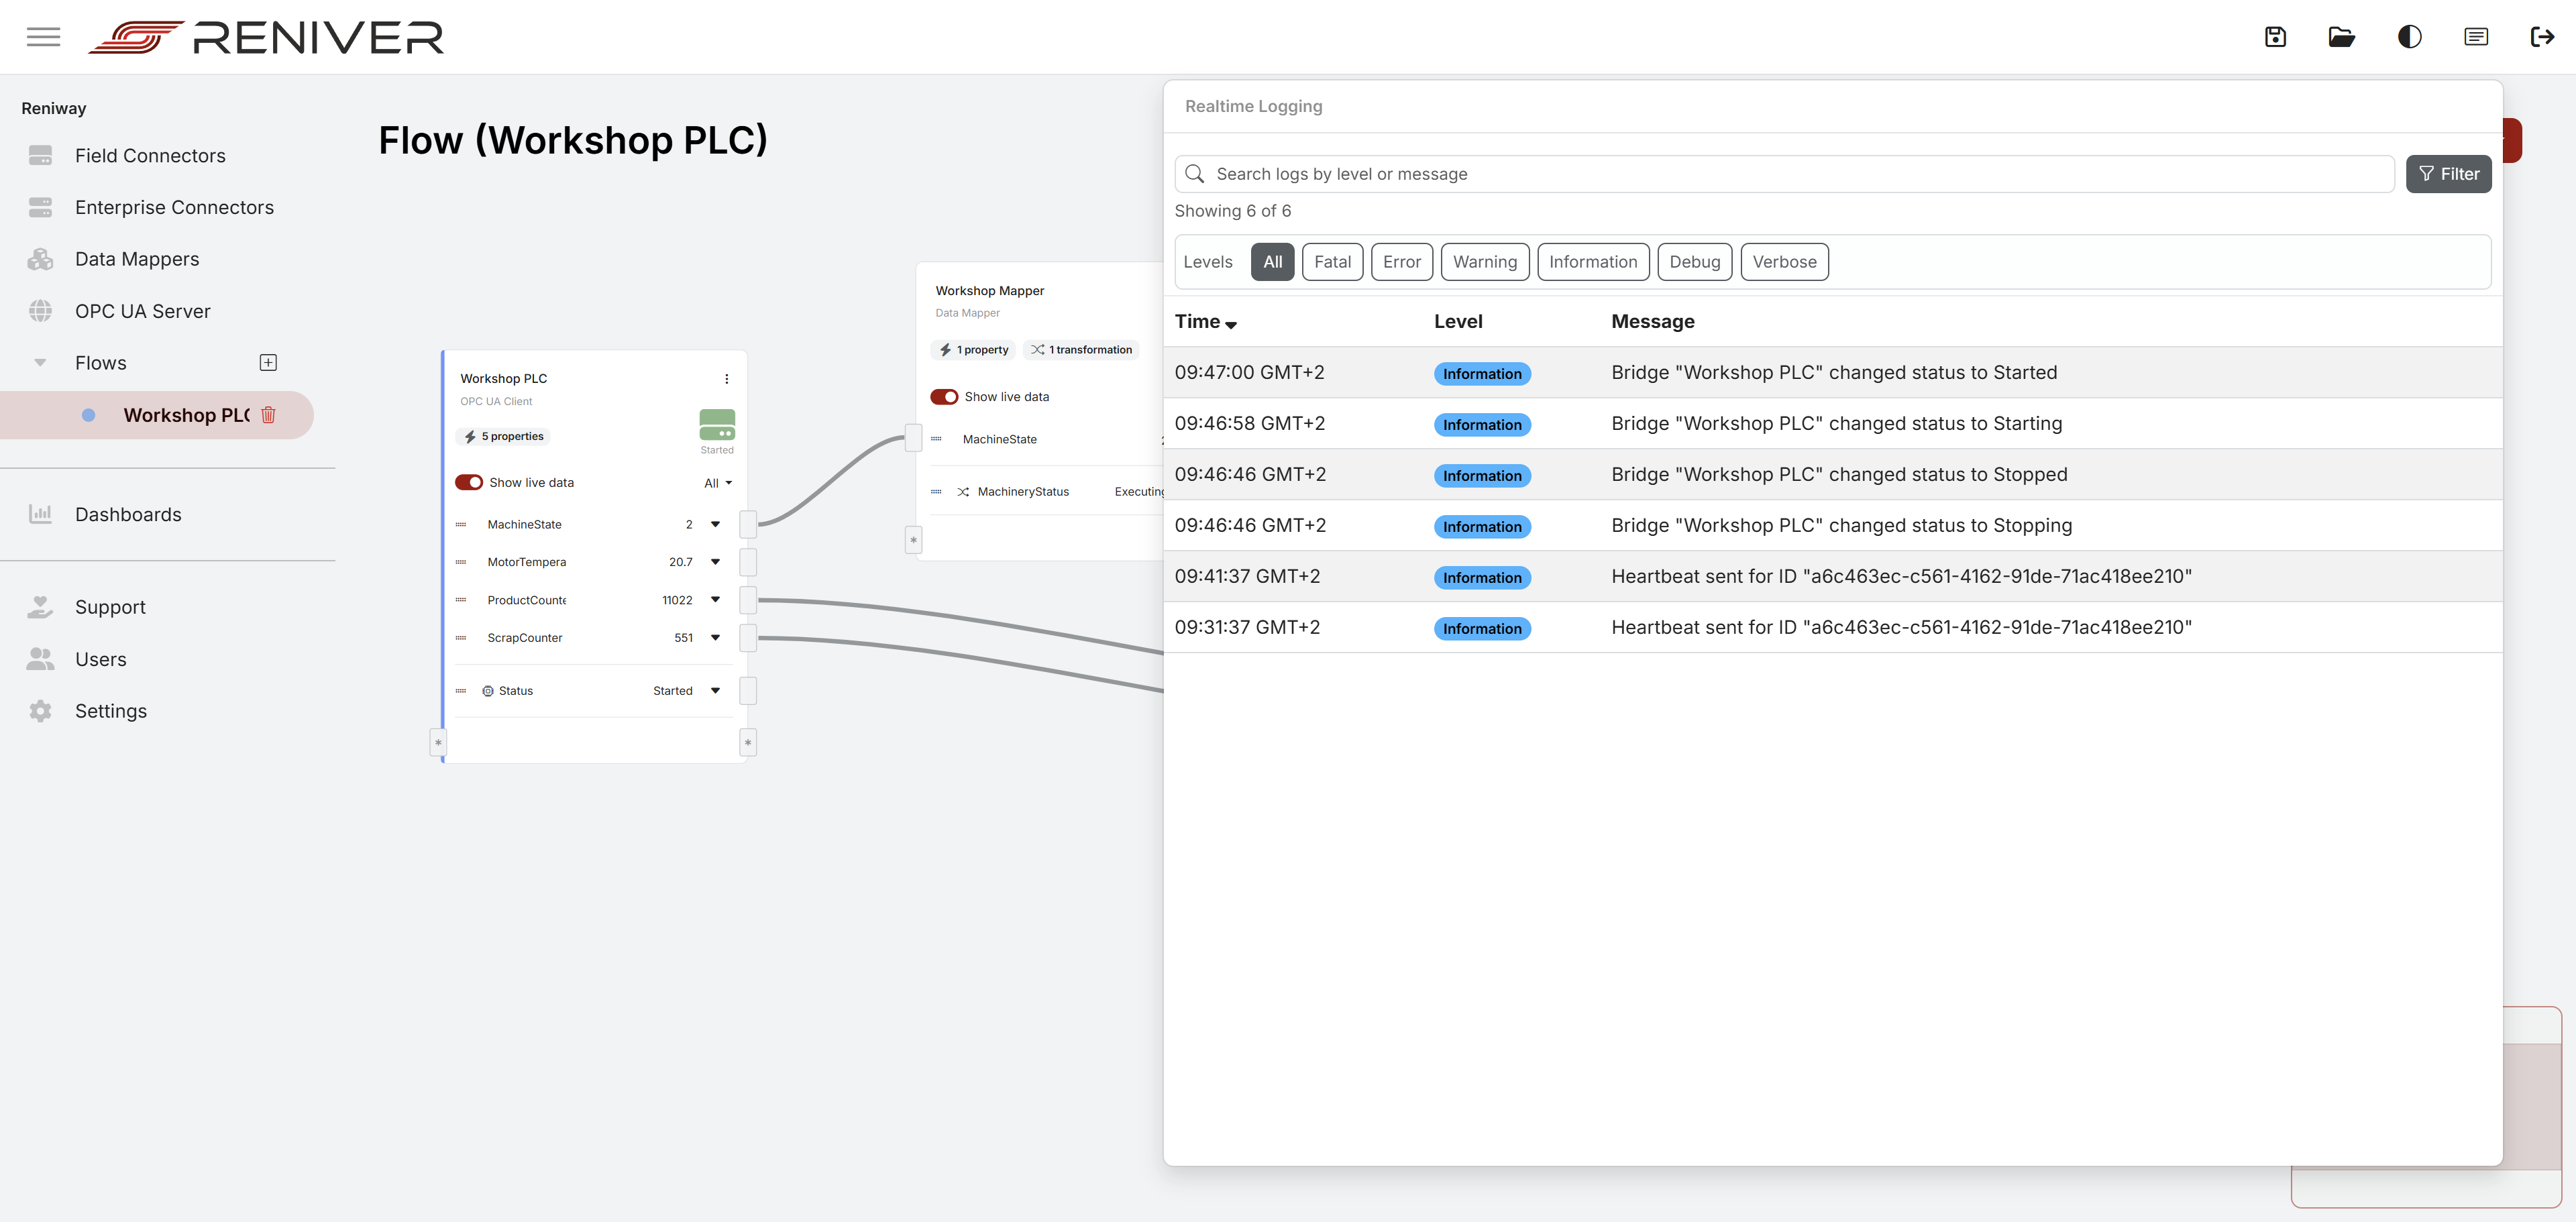
The logging window shows recent realtime log messages from the running system.
It includes:
- a search bar that filters log messages by severity level or message text
- a
Filterbutton that opens the severity filter panel - severity filters for
Fatal,Error,Warning,Information,Debug, andVerbose - an
Allshortcut to show every severity again - a time column that can be toggled between newest-first and oldest-first sorting
Search hits are highlighted directly in the message text.
Local timestamps
The time column is displayed in the current user's timezone.
That means:
- different users can see the same event in their own local time
- log timestamps match the timezone selected on the user profile
- live value timestamps and value change timestamps also follow that same user timezone
If no user-specific timezone is stored, the interface falls back to the browser timezone. If the browser timezone cannot be resolved, the fallback is UTC.
For more about user accounts and timezone settings, see Users and Permissions.
When to use it
Use the realtime logging window when you want to:
- confirm that a connector started successfully
- spot certificate or connection problems
- validate that a flow or data mapper is producing updates
- check warnings and errors during commissioning