Beckhoff PLC to Reniway Edge Workshop
:::info Trainer-Led Physical Lab Workshop This workshop is delivered with a physical lab setup and a trainer from Reniver. It is intended for guided training sessions where trainees work on prepared Beckhoff PLC and Reniway Edge hardware. To organize this training for your team, inquire at sales@reniver.eu. :::
Goal
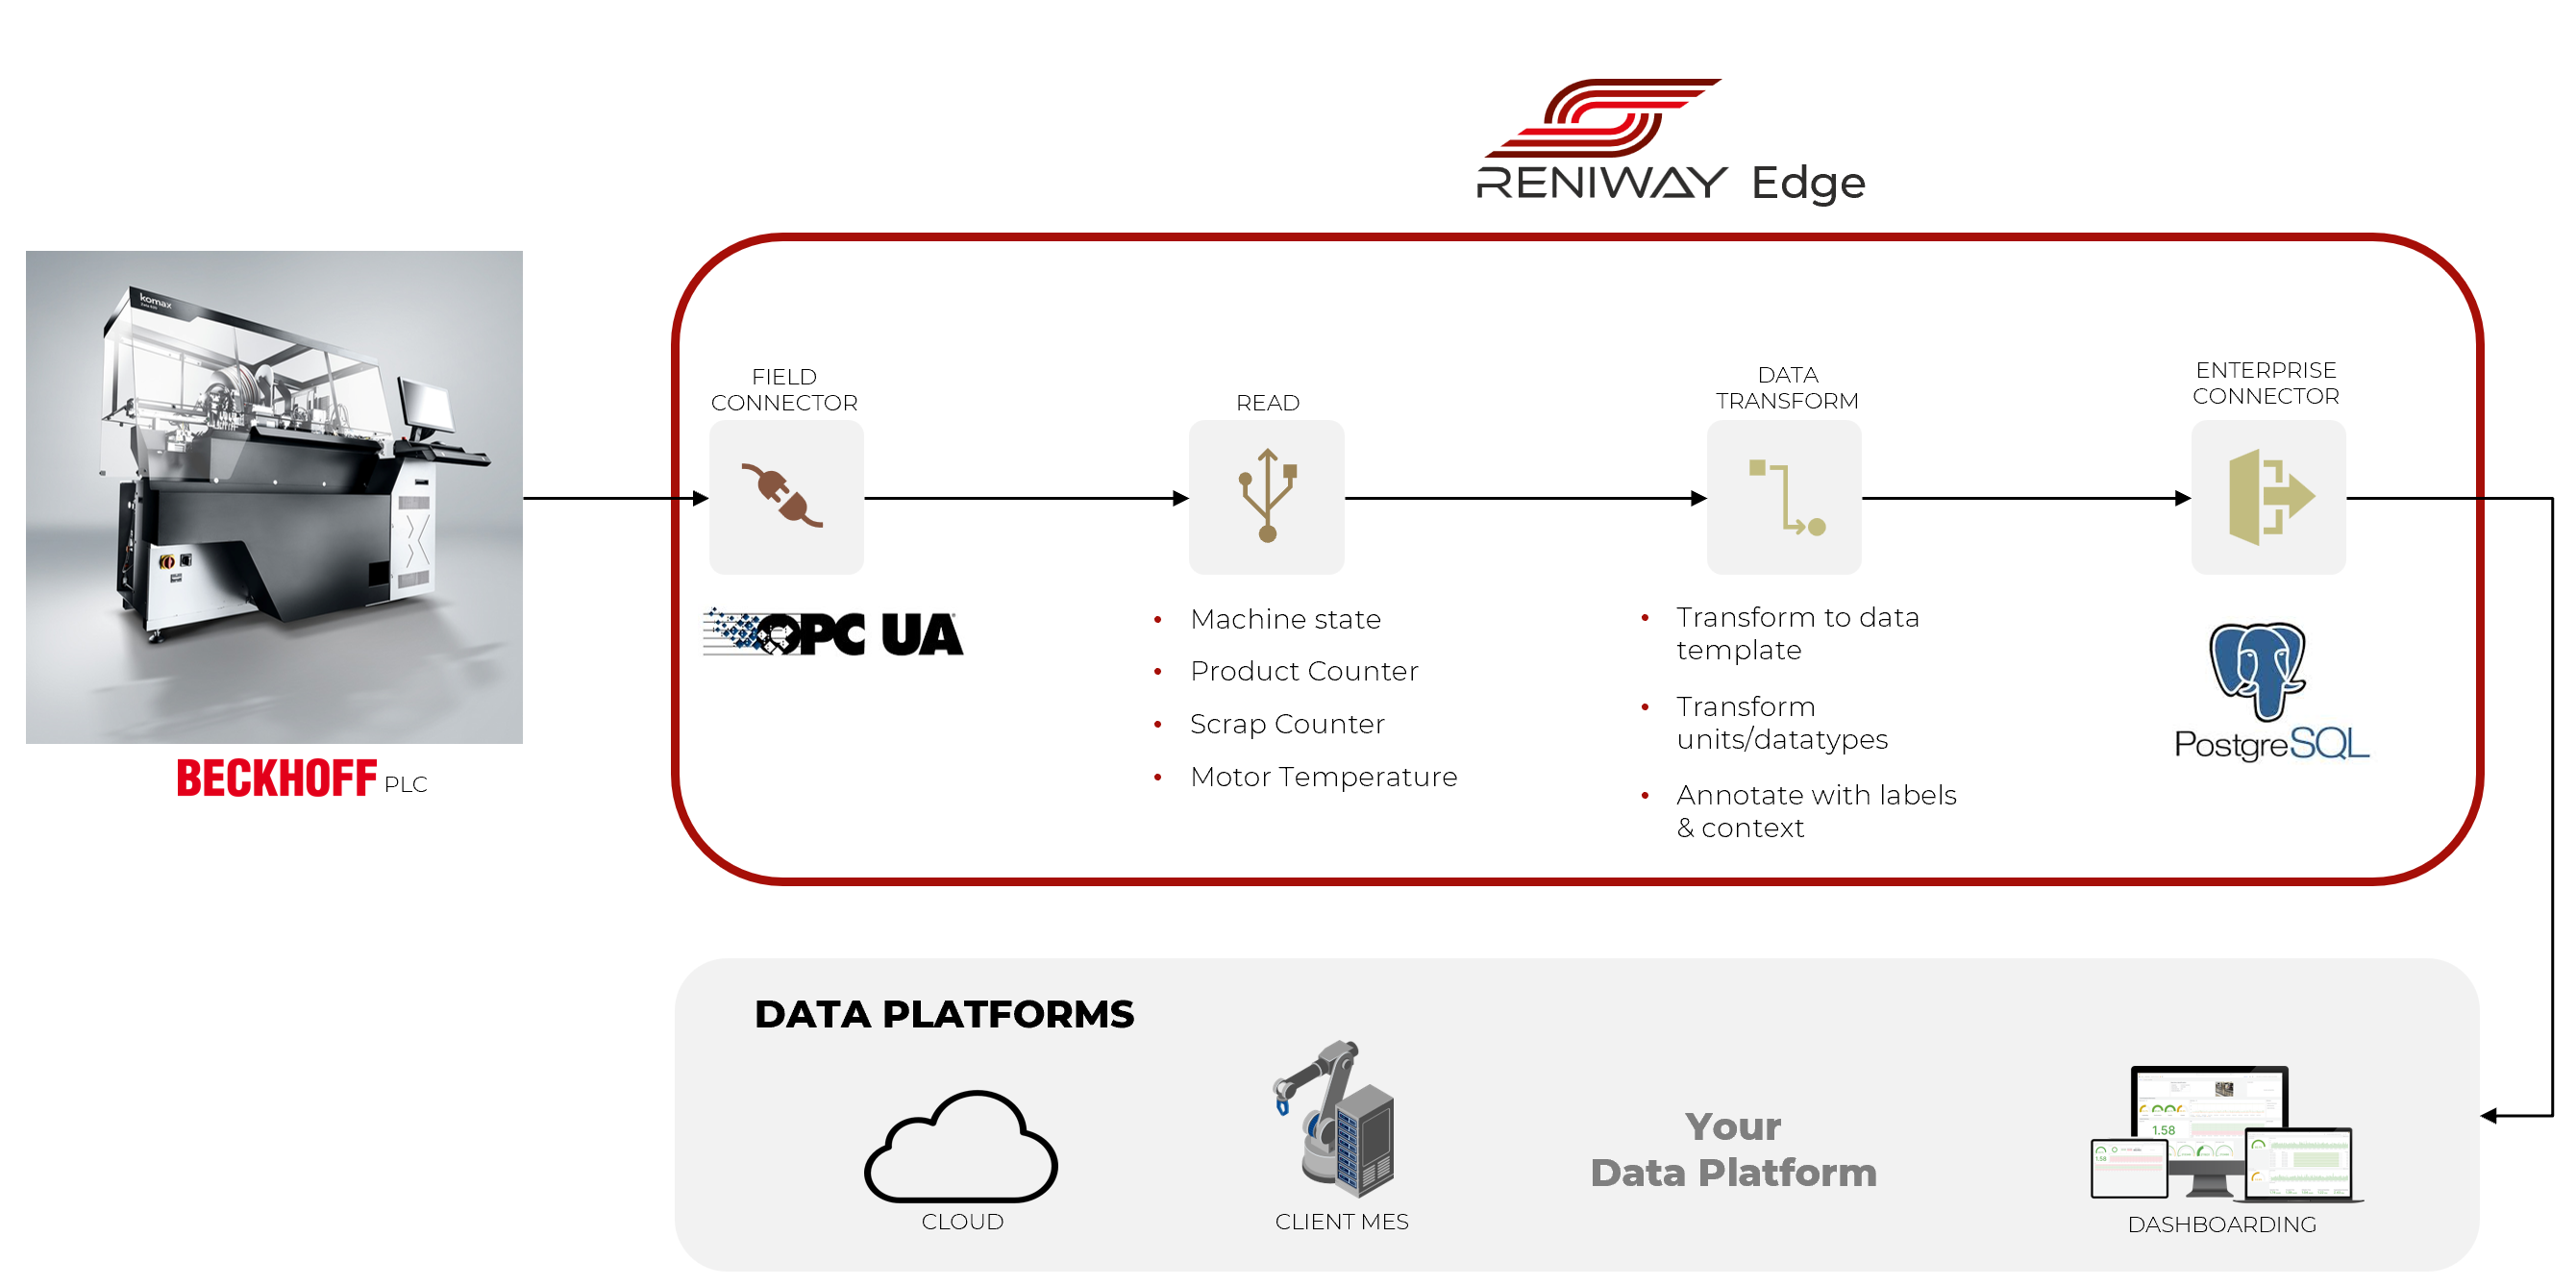
In this workshop you will connect a Beckhoff PLC to Reniway Edge over OPC UA, store selected values in PostgreSQL, translate the PackML machine state into readable text with a Data Mapper, and finally build your own Grafana dashboard on top of that data.
What You Will Build
The following architecture slide shows the end-to-end workshop setup:
Workshop Environment
| Item | Value |
|---|---|
| Edge PC IPs | 192.168.101.50 or 192.168.101.51 or 192.168.101.52 or 192.168.101.53 |
| Reniway URL | https://[EDGE-IP] |
| PLC OPC UA endpoint | opc.tcp://192.168.101.207:4840 |
| DBGate URL | https://[EDGE-IP]/database |
| DBGate username | patron |
| DBGate password | Ronpat10 |
| PostgreSQL host | timescaledb |
| PostgreSQL port | 5432 |
| Workshop database | workshopdb |
| Grafana URL | https://[EDGE-IP]/dashboards |
| Grafana username | admin |
| Grafana password | admin |
Replace [EDGE-IP] with the Edge PC assigned to your group.
Why These Reniway Building Blocks Matter
From the official Reniway documentation :
- Field connectors communicate with machines and sensors in the field.
- Enterprise connectors send data onward to MES, ERP, cloud systems, or other data platforms.
- Flows are the page where you assemble connectors and data mappers from the menu in the top-right corner.
- Data Mappers can transform values using JavaScript, for example by converting alarm codes or machine states into readable text.
- If an OPC UA server uses certificates and you run into trust issues, the global Settings > Connectors > OPC UA Client page contains an Auto Accept Certificates option.
A good mental model for this workshop is therefore:
- Read raw values from the Beckhoff PLC with a field connector.
- Transform the machine state with a data mapper.
- Write everything to PostgreSQL with an enterprise connector.
- Visualize the result in Grafana.
Step 1 — Open Reniway Edge and Register a User
Open a browser and go to the Edge PC assigned to your group.
- First Edge PC:
https://192.168.101.50 - Second Edge PC:
https://192.168.101.51
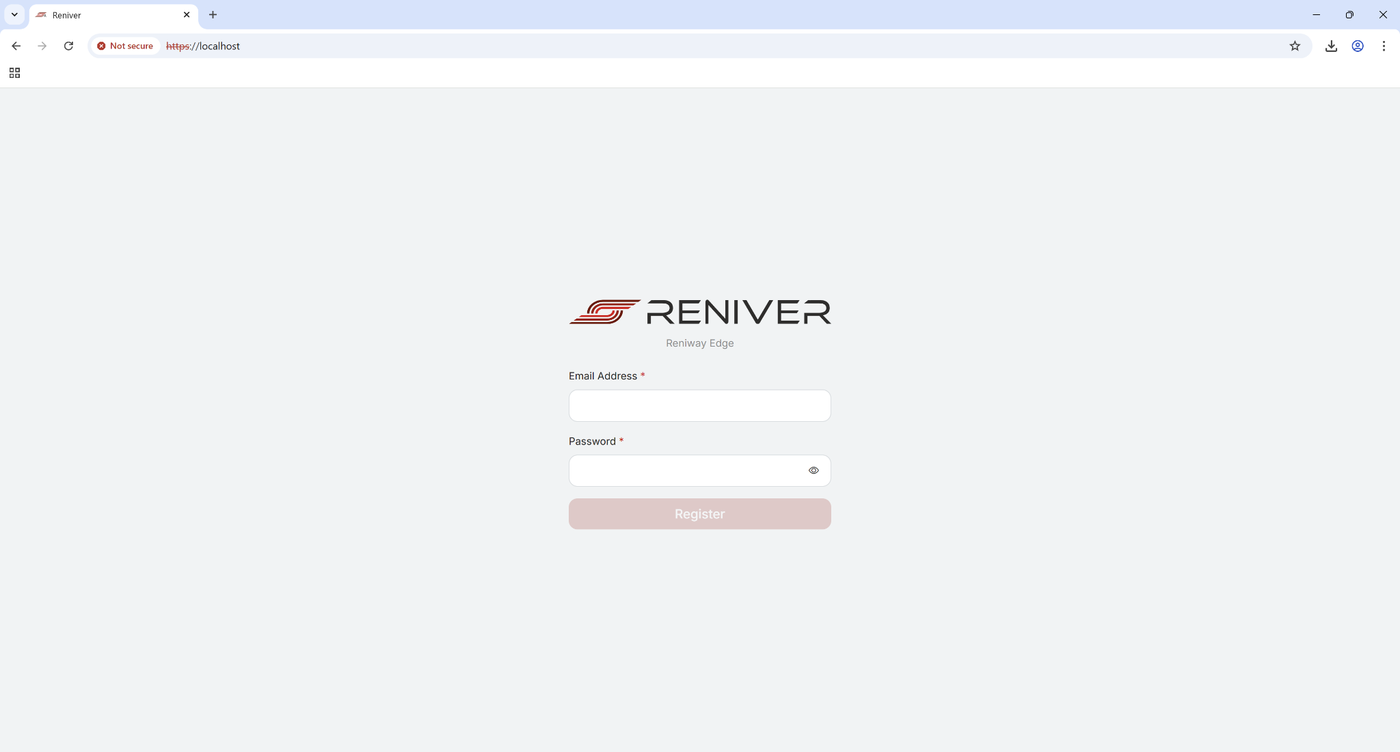
If this is the first time you use the system, register a user with your email address and a password.
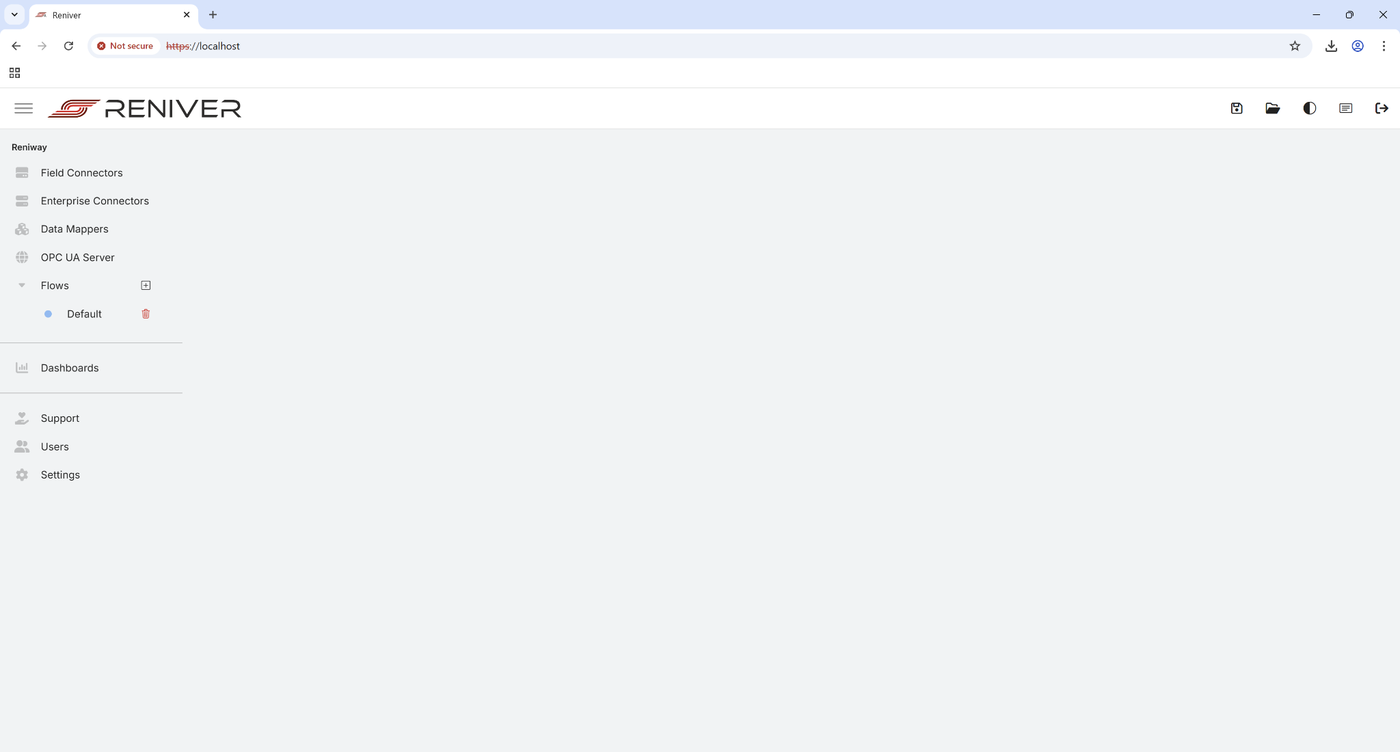
After logging in, take one minute to click through the menu on the left side so you know where the major areas are:
- Field Connectors
- Enterprise Connectors
- Data Mappers
- OPC UA Server
- Flows
- Dashboards
- Support
- Users
- Settings
The official Reniway quickstart shows that the first-time login starts from the local web interface, and the documentation also notes that a valid license must already be loaded before the full interface becomes available.
Step 2 — Open the Default Flow and Rename It
Open Flows in the left menu and select the Default flow.
Use the Menu button in the top-right corner or right-click anywhere in the flow and choose Rename flow. Rename it to:
Workshop PLC
You will also use this same menu later to add connectors and a data mapper.
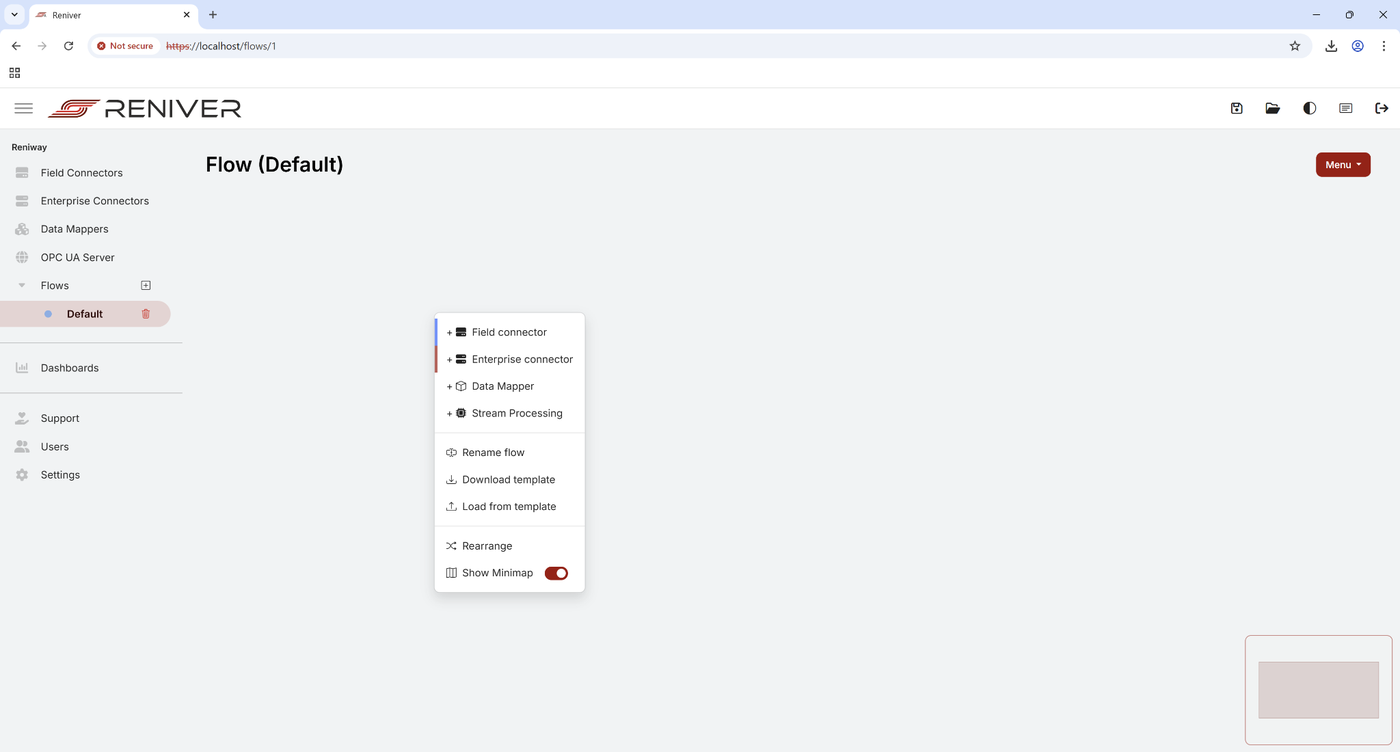
The Flows page is the place where connectors and data mappers are added from the top-right menu or right-click button. Field connectors are shown in blue and enterprise connectors in red.
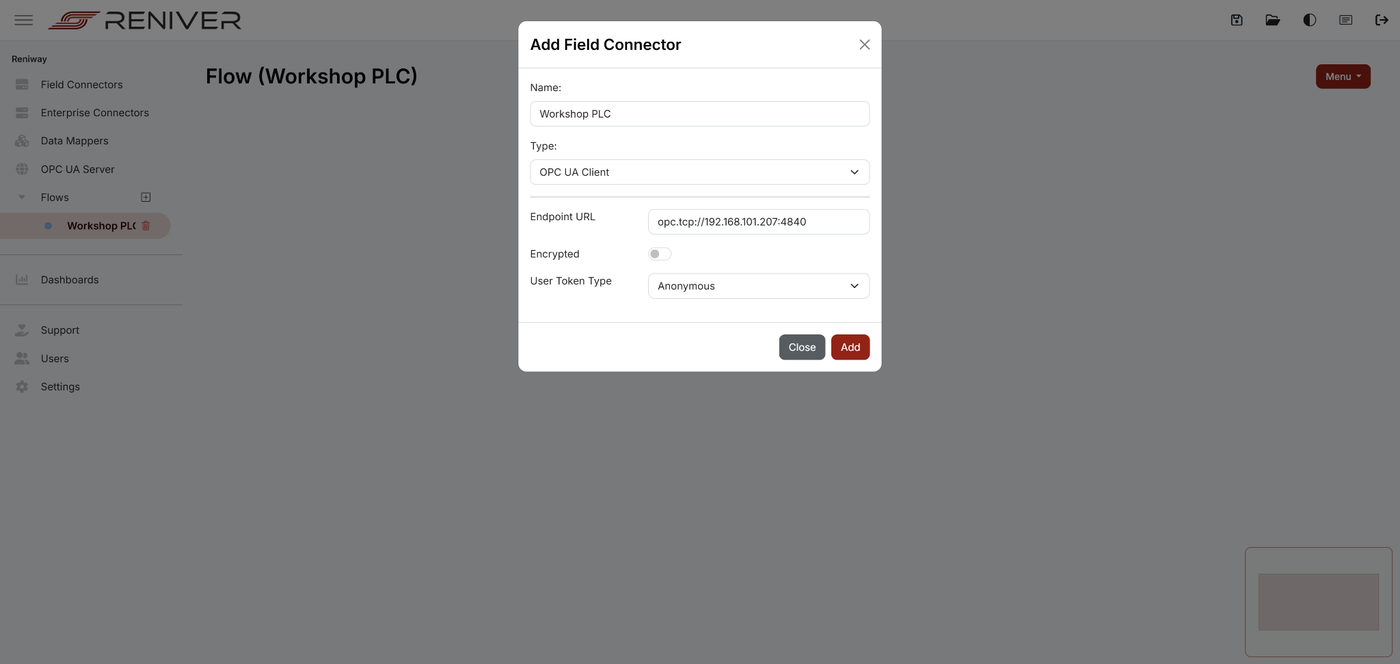
Step 3 — Add the OPC UA Field Connector
From the flow menu, choose Field Connector and configure it as follows:
| Setting | Value |
|---|---|
| Name | Workshop PLC |
| Type | OPC UA Client |
| Endpoint URL | opc.tcp://192.168.101.207:4840 |
| Encrypted | Off |
| User Token Type | Anonymous |
Then click Add.
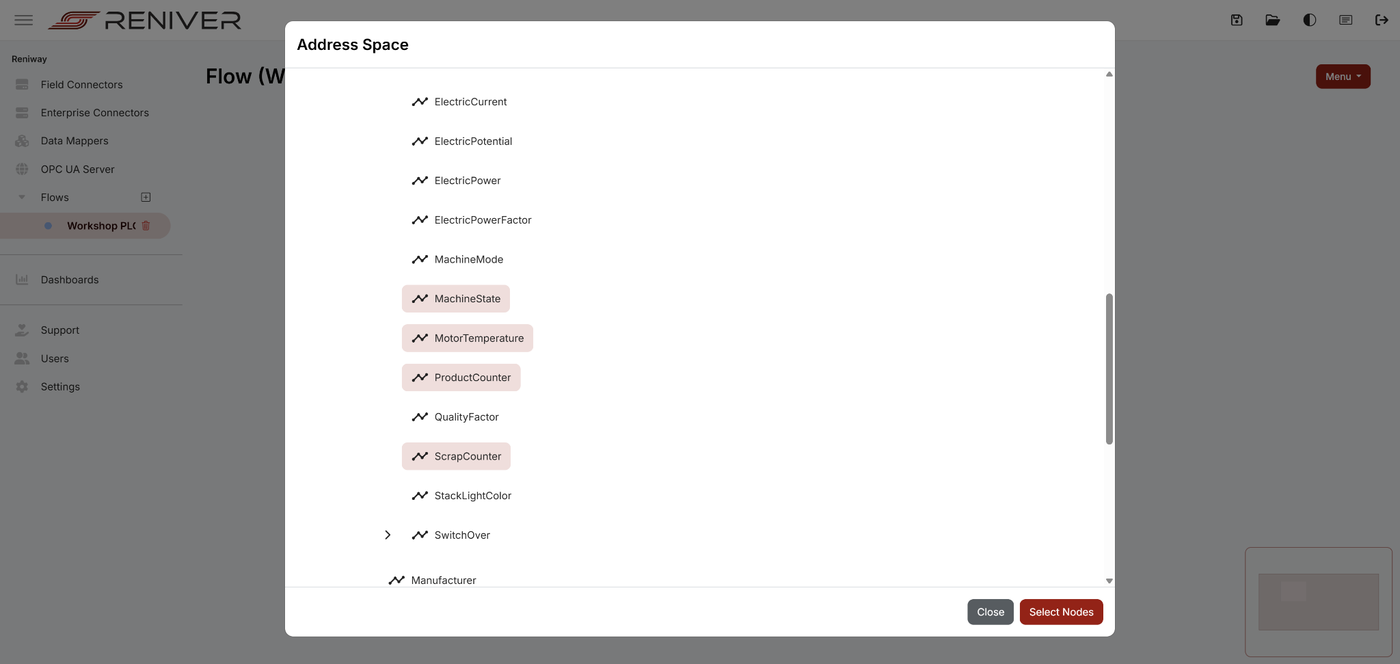
Add the PLC Properties
Use Add new property and browse the address space to find and select these four PLC nodes:
PLC/MAIN/MachineStatePLC/MAIN/MotorTemperaturePLC/MAIN/ProductCounterPLC/MAIN/ScrapCounter
Note that you can use ctrl-click to select multiple OPC UA Nodes.
When the properties are added successfully, switch on Show live data to confirm the connector is receiving values.
If the OPC UA connection does not come up and your server uses certificates, check Settings > Connectors > OPC UA Client and enable Auto Accept Certificates if your instructor tells you to do so.
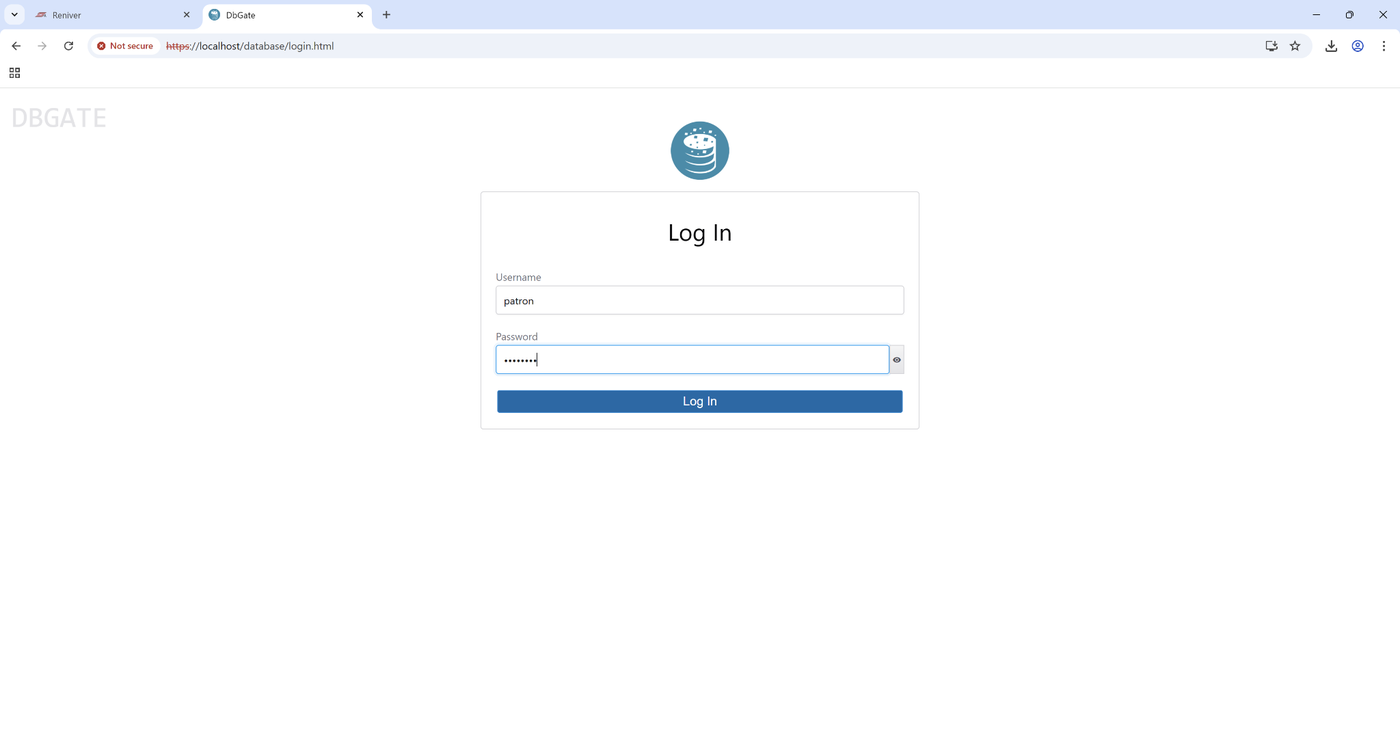
Step 4 — Open DBGate on the Edge PC
DBGate is a web-based database manager. This allows us to create a database to store the PLC data and check if the data is received correctly.
Open:
https://[EDGE-IP]/database
Log in with the workshop credentials:
- Username:
patron - Password:
Ronpat10
Step 5 — Create a PostgreSQL Connection in DBGate
Create a new PostgreSQL connection with these settings:
| Setting | Value |
|---|---|
| Connection type | PostgreSQL |
| Server | timescaledb |
| Port | 5432 |
| User | patron |
| Password | Ronpat10 |
Use Test first and then Connect.
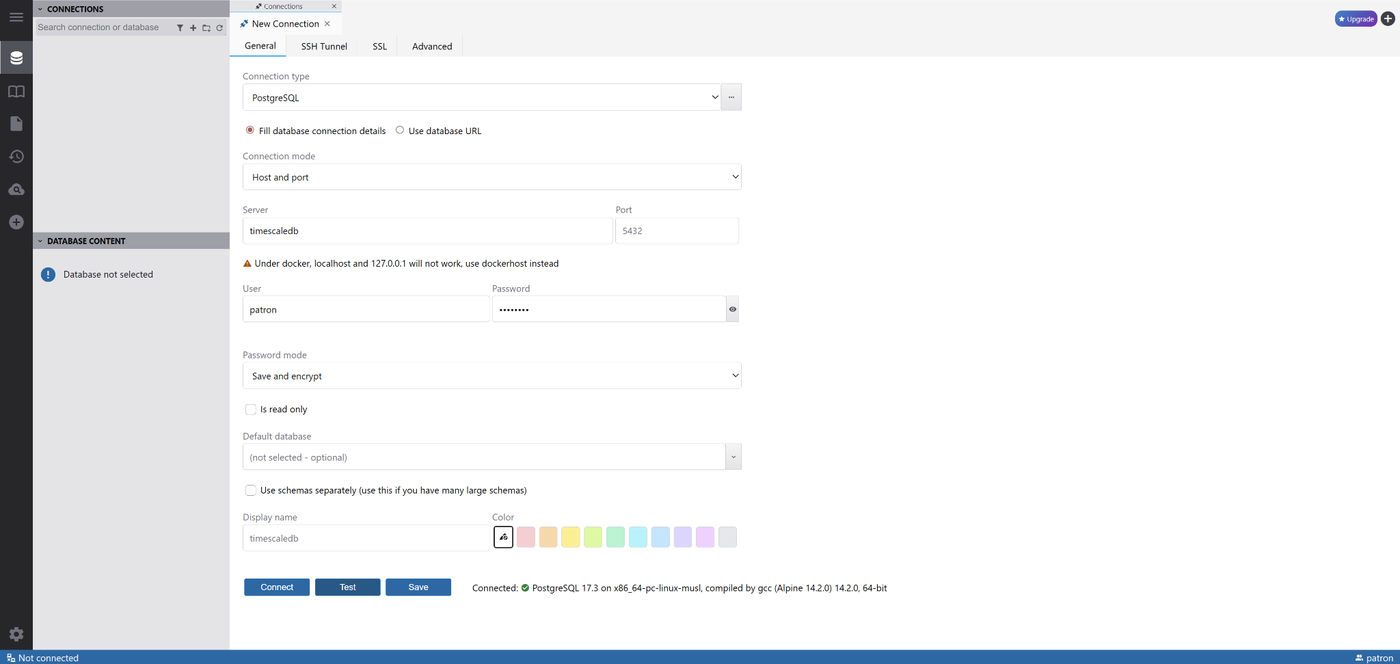
In this workshop environment the database host shown in the screenshots is timescaledb. If that hostname does not resolve in your setup, ask the instructor before changing it.
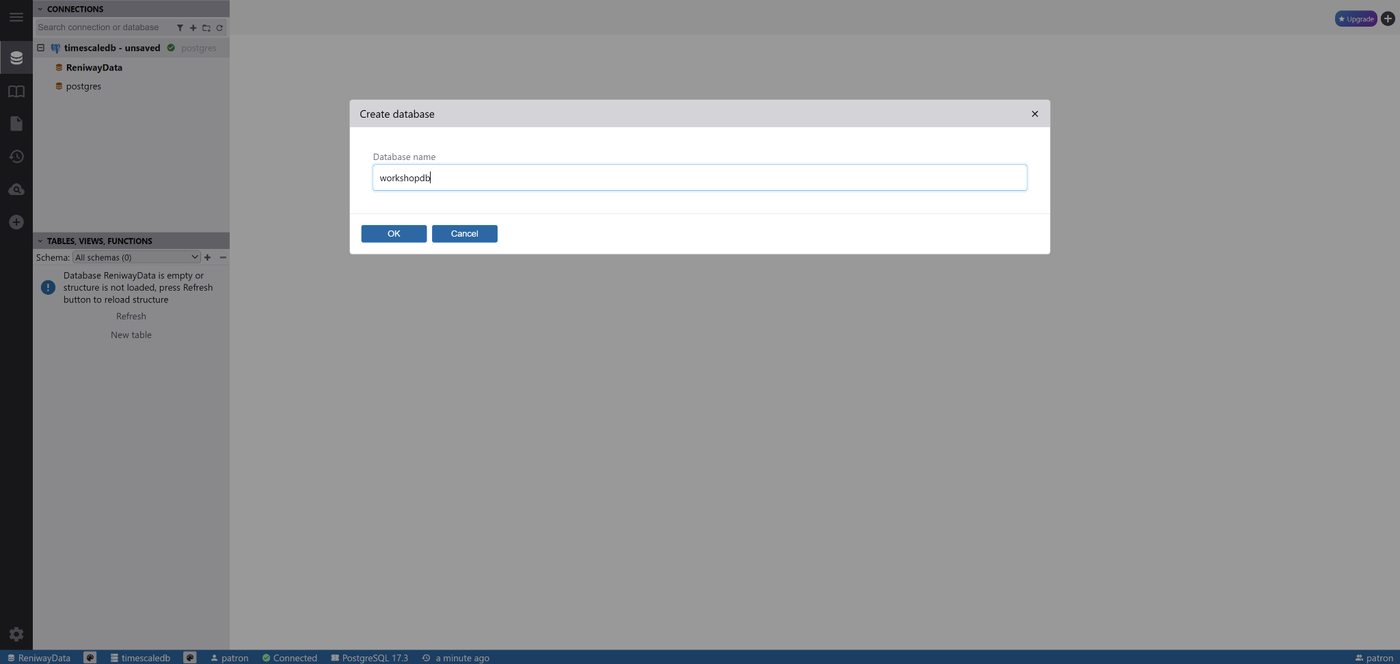
Step 6 — Create the Workshop Database
Create a new database by right clicking the timescaledb connection and selecting Create database
Name of the database:
workshopdb
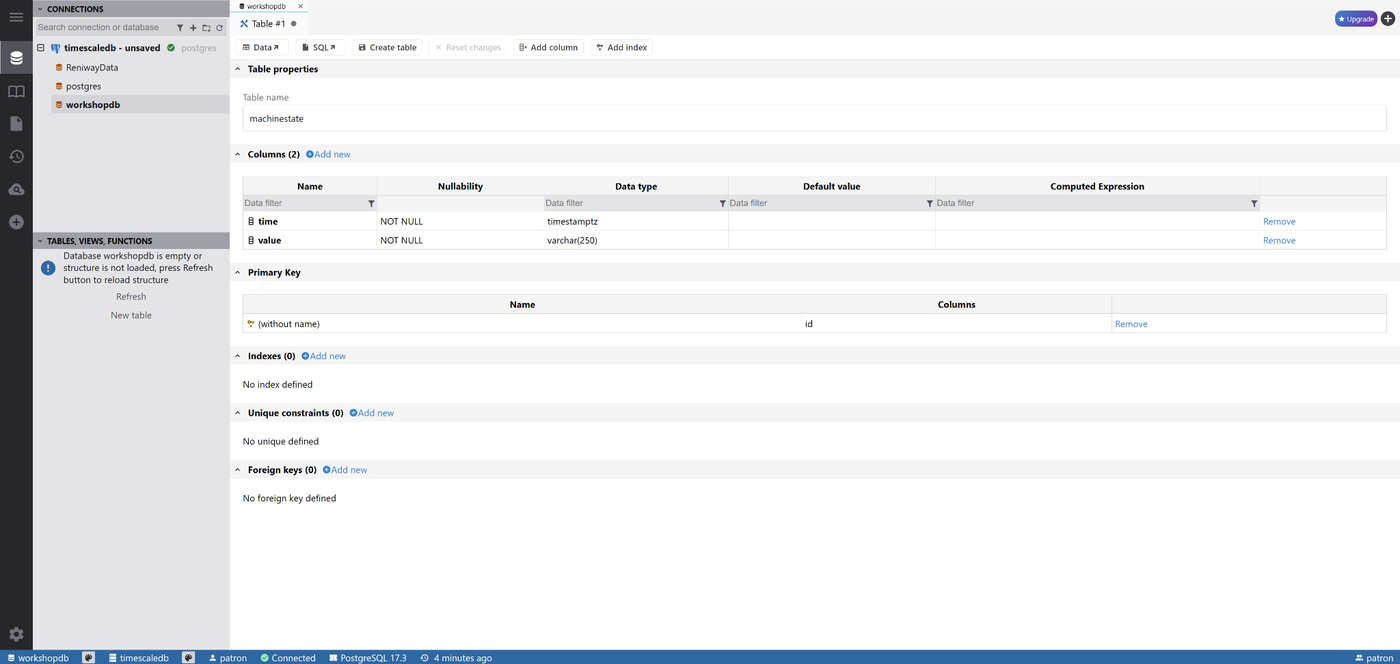
Step 7 — Create the Four Workshop Tables
Right click workshopdb and click New Table to create these four tables inside workshopdb:
machinestateproductcounterscrapcountermotortemperature
Use the following columns:
| Table | Column 1 Name | Column 1 Datatype | Column 2 Name | Column 2 Datatype |
|---|---|---|---|---|
machinestate | time | timestamptz | value | varchar(250) |
productcounter | time | timestamptz | value | int |
scrapcounter | time | timestamptz | value | int |
motortemperature | time | timestamptz | value | double precision |
While creating each table:
- keep only the
timeandvaluecolumns - remove the automatically created primary key
id - save the table
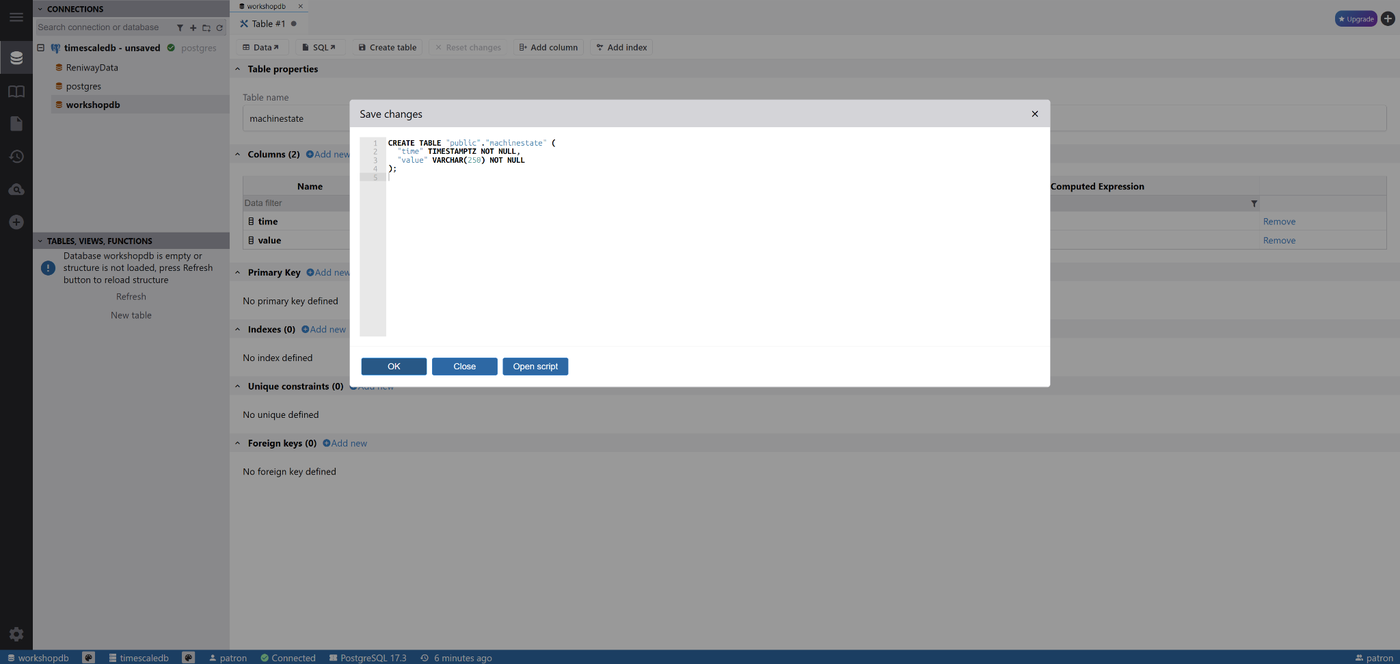
The SQL preview for machinestate should end up looking like this:
CREATE TABLE "public"."machinestate" (
    "time" TIMESTAMPTZ NOT NULL,
    "value" VARCHAR(250) NOT NULL
);
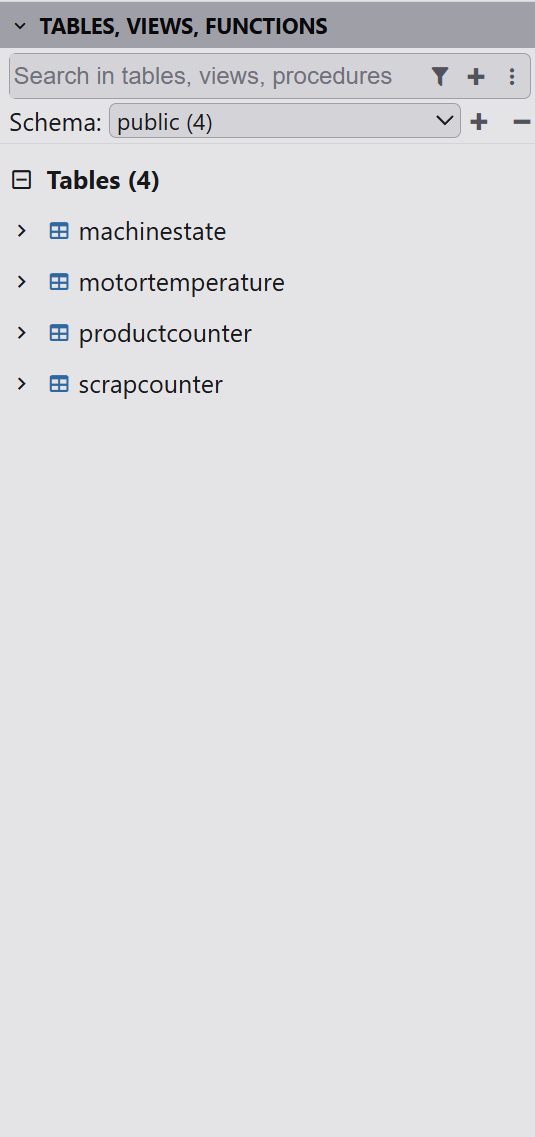
After repeating the same process for all four tables, you should see this result in DBGate:
Optional SQL Shortcut
If you prefer to create the tables with SQL instead of the DBGate table designer right click workshopdb and select New query paste the script below and press the Execute button:
CREATE TABLE machinestate (
    "time" timestamptz NOT NULL,
    value varchar(250) NOT NULL
);

CREATE TABLE productcounter (
    "time" timestamptz NOT NULL,
    value integer NOT NULL
);

CREATE TABLE scrapcounter (
    "time" timestamptz NOT NULL,
    value integer NOT NULL
);

CREATE TABLE motortemperature (
    "time" timestamptz NOT NULL,
    value double precision NOT NULL
);
Step 8 — Add the SQL Enterprise Connector in Reniway
Go back to the Workshop PLC flow in Reniway.
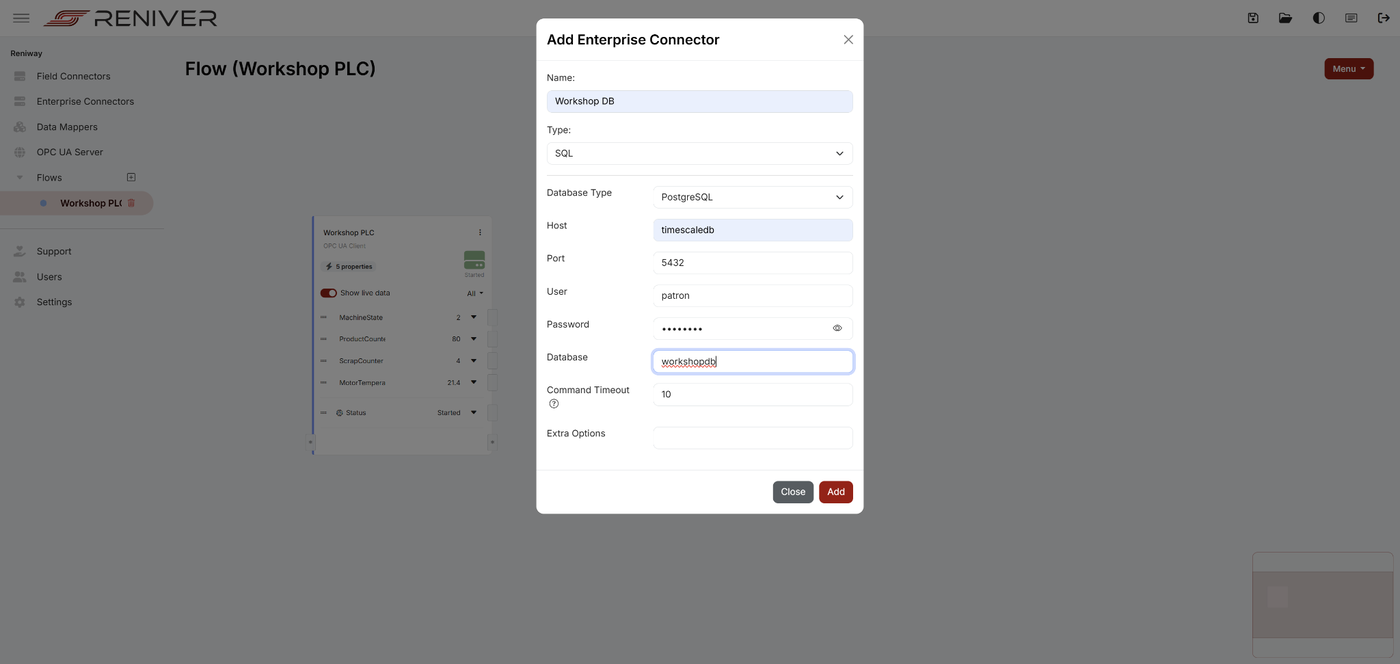
From the flow menu, choose Enterprise Connector and configure it like this:
| Setting | Value |
|---|---|
| Name | Workshop DB |
| Type | SQL |
| Database Type | PostgreSQL |
| Host | timescaledb |
| Port | 5432 |
| User | patron |
| Password | Ronpat10 |
| Database | workshopdb |
| Command Timeout | 10 |
Then click Add.
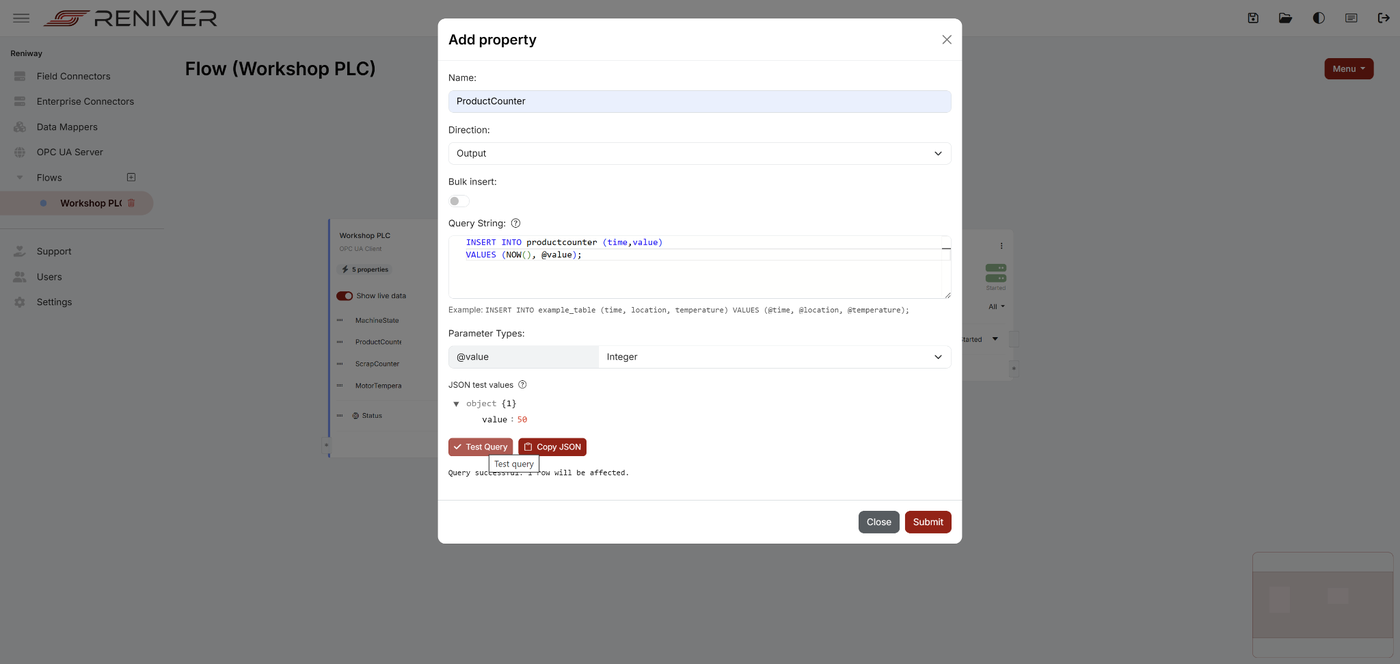
Step 9 — Add Four SQL Properties
Add these four properties to the SQL connector:
MachineStateMotorTemperatureProductCounterScrapCounter
Set the Direction to Output for each one.
A property in the SQL connector writes incoming data to one table using an INSERT query.
Example: ProductCounter
Use this query for the ProductCounter property:
INSERT INTO productcounter ("time", value)
VALUES (NOW(), @value);
For this example, set @value to type Integer.
You can test the query by entering a JSON test value and pressing Test Query.
Recommended SQL Per Property
Use these queries:
ProductCounter
INSERT INTO productcounter ("time", value)
VALUES (NOW(), @value);
Parameter type: Integer
ScrapCounter
INSERT INTO scrapcounter ("time", value)
VALUES (NOW(), @value);
Parameter type: Integer
MotorTemperature
INSERT INTO motortemperature ("time", value)
VALUES (NOW(), @value);
Parameter type: Double / Float
MachineState
INSERT INTO machinestate ("time", value)
VALUES (NOW(), @value);
Parameter type: String / Text
The NOW() function is used so every inserted record gets the current timestamp from PostgreSQL at the moment of insertion.
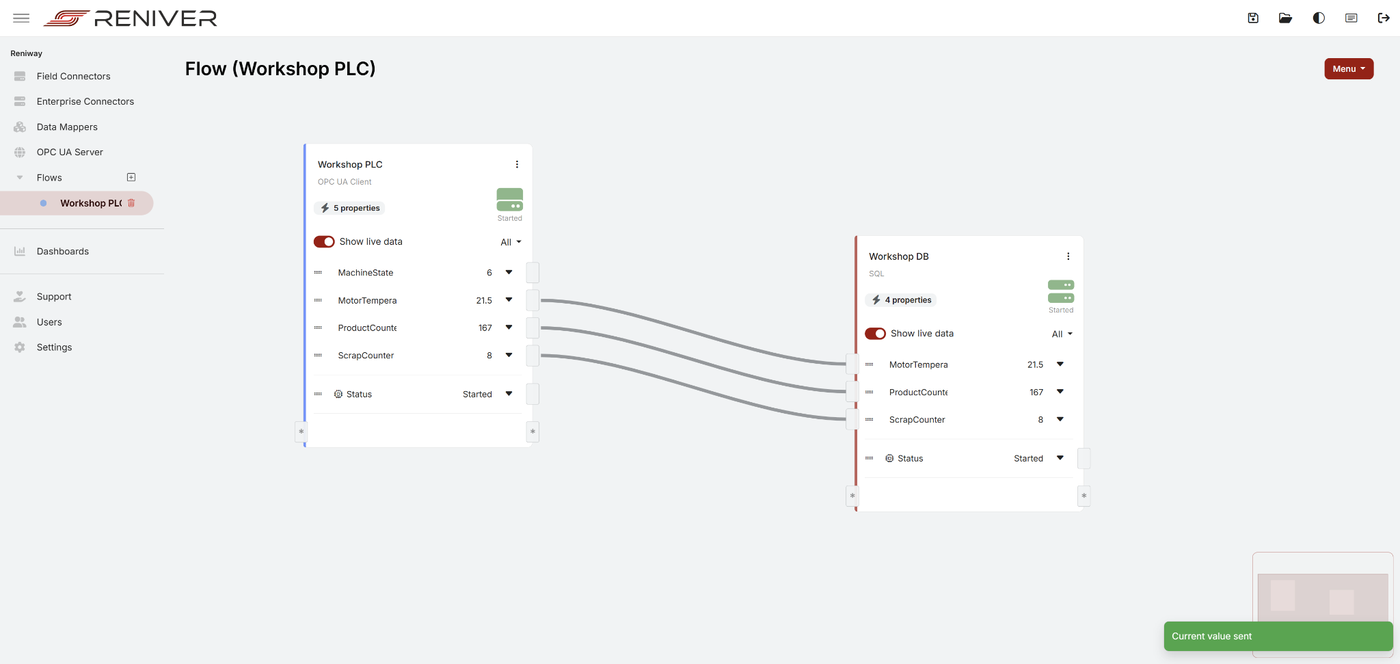
Step 10 — Wire the Direct Values in the Flow
Connect these three properties directly from the OPC UA field connector to the SQL enterprise connector:
ProductCounterScrapCounterMotorTemperature
Do not connect MachineState directly yet. That value will first be transformed into a readable state name.
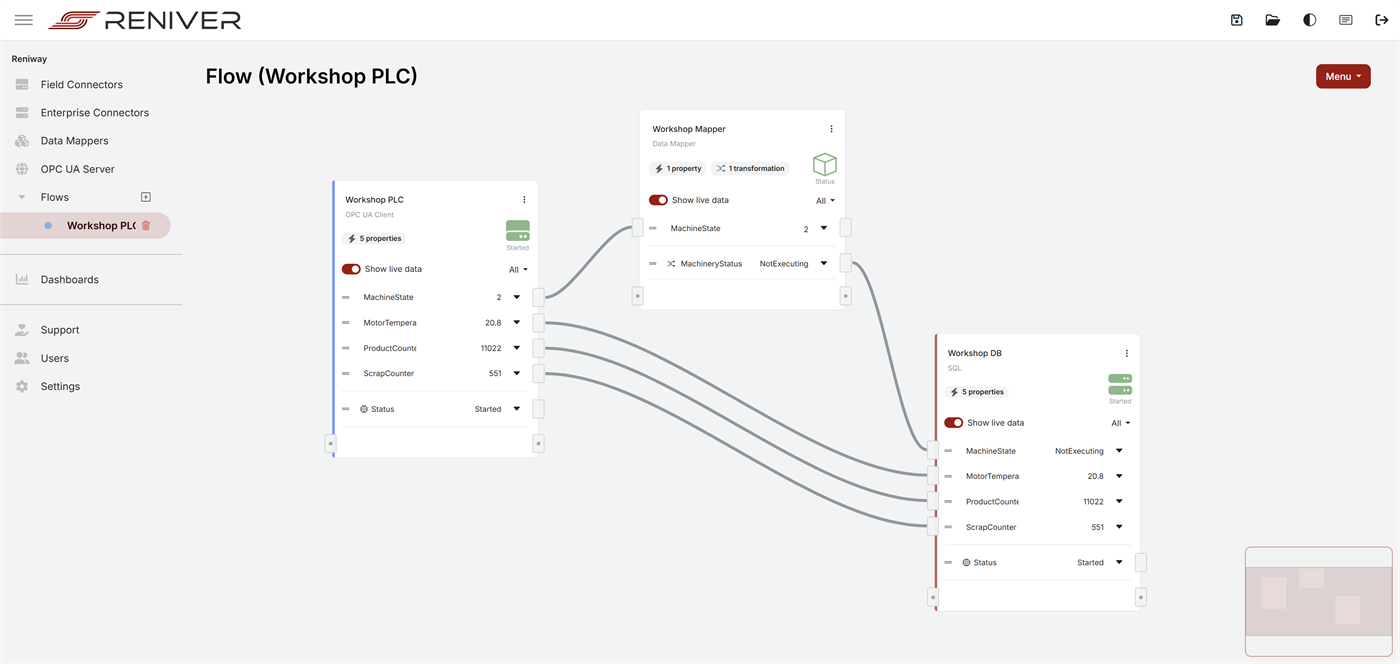
At this stage your flow should look similar to this:
Step 11 — Add a Data Mapper for MachineState
Now add a Data Mapper in the flow.
The purpose of the Data Mapper is to translate the raw numeric Beckhoff / PackML machine state into a readable OPC UA for Machinery style state name.
In the official Reniway documentation, a Data Mapper is the component that groups related data and performs transformations using JavaScript.
What to Do
- Add a Data Mapper from the flow menu.
- Drag
MachineStatefrom the OPC UA field connector onto the automapper input of the Data Mapper. - Create a transformation that converts the incoming numeric state to readable text.
- Connect the output of the transformation to the
MachineStateproperty on the SQL connector.
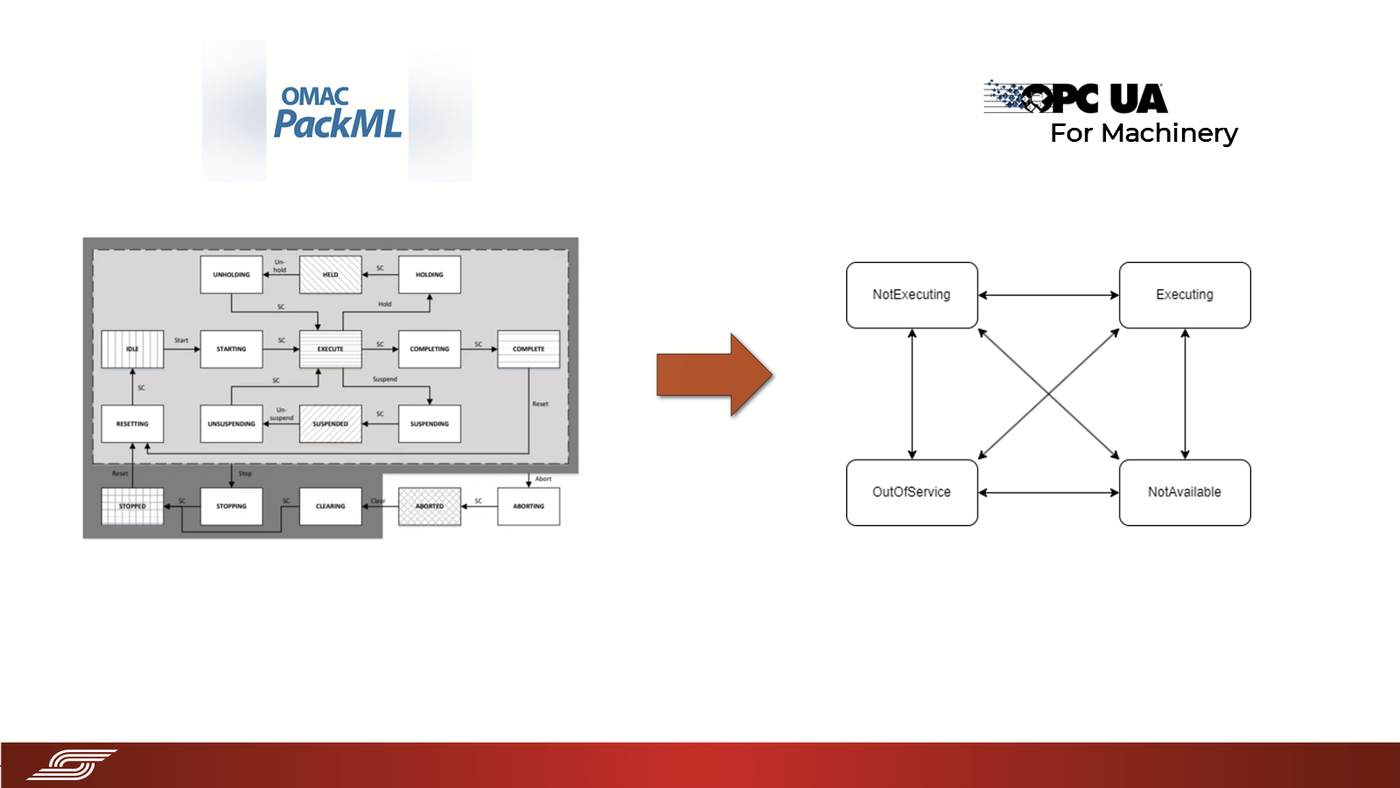
Machine State Mapping
The goal of this transformation is to write a JavaScript funtion that maps the extensive PackML machine status, which is often used in PLC control programming, to a much simpler machine status defined by the specification OPC UA for Machinery which is used for monitoring machinery and calculating KPIs like Availability (OEE)
Transformation Script
What to Do
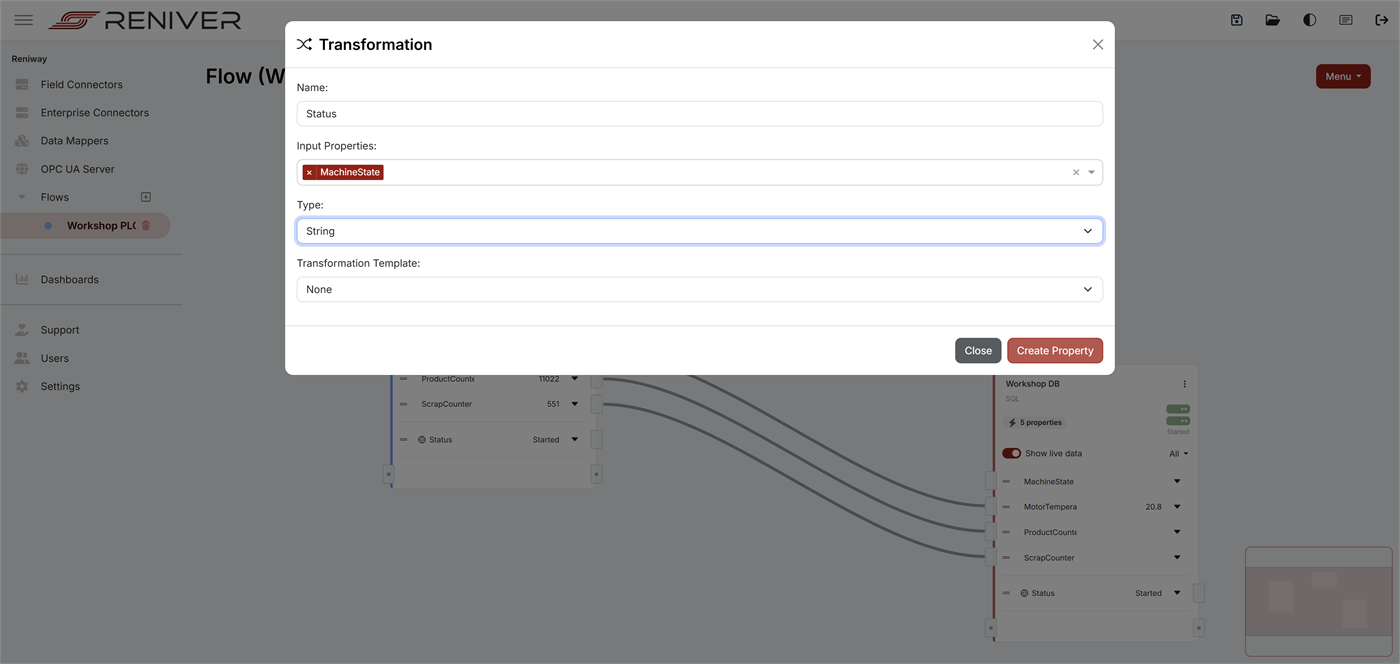
- Click Add Transformation from the Datamapper context menu and enter the following:
- Name:
MachineryStatus - Select
MachineStateas input property - Select
StringasType - Click
Create Property
- Paste this JavaScript into the Data Mapper transformation:
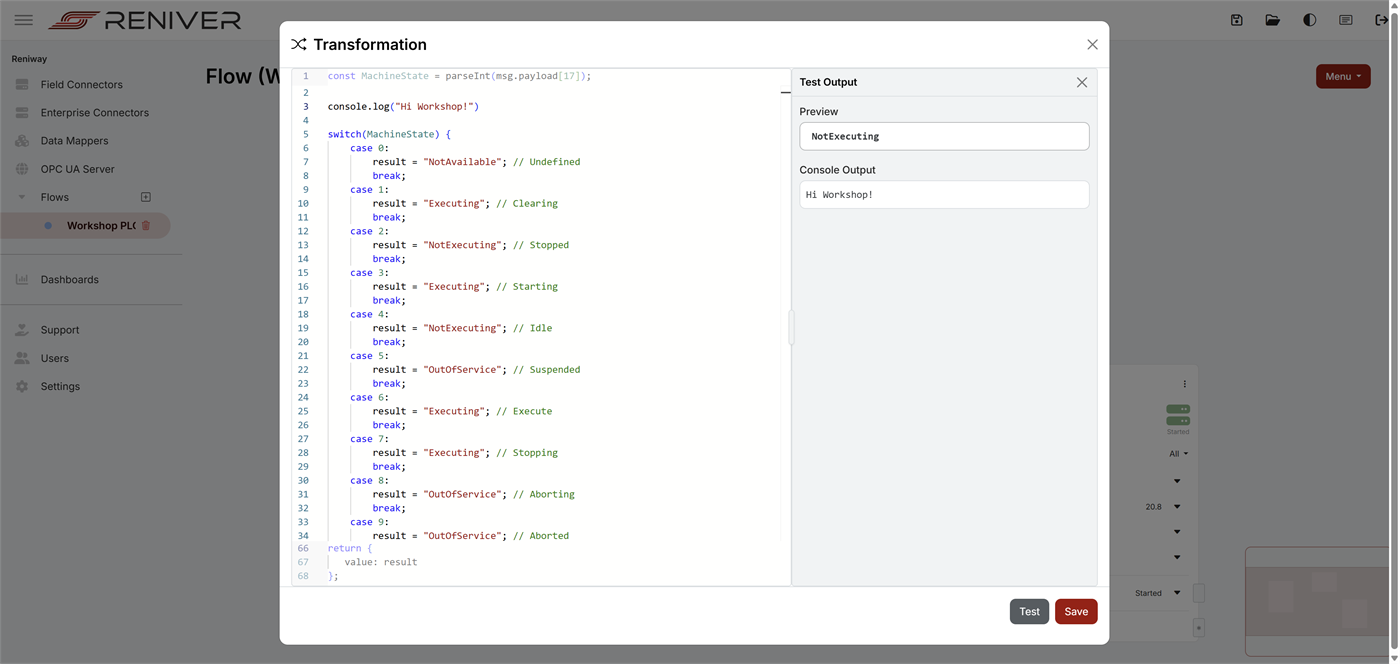
switch(MachineState) {
    case 0:
        result = "NotAvailable"; // Undefined
        break;
    case 1:
        result = "Executing"; // Clearing
        break;
    case 2:
        result = "NotExecuting"; // Stopped
        break;
    case 3:
        result = "Executing"; // Starting
        break;
    case 4:
        result = "NotExecuting"; // Idle
        break;
    case 5:
        result = "OutOfService"; // Suspended
        break;
    case 6:
        result = "Executing"; // Execute
        break;
    case 7:
        result = "Executing"; // Stopping
        break;
    case 8:
        result = "OutOfService"; // Aborting
        break;
    case 9:
        result = "OutOfService"; // Aborted
        break;
    case 10:
        result = "NotAvailable"; // Holding
        break;
    case 11:
        result = "NotAvailable"; // Held
        break;
    case 12:
        result = "NotAvailable"; // Unholding
        break;
    case 13:
        result = "NotAvailable"; // Suspending
        break;
    case 14:
        result = "NotAvailable"; // Unsuspending
        break;
    case 15:
        result = "NotAvailable"; // Resetting
        break;
    case 16:
        result = "Executing"; // Completing
        break;
    case 17:
        result = "Executing"; // Completed
        break;
    default:
        result = "OutOfService";
        break;
}
You can add any console.log() to add debugging prints to the function.
When clicking Test the function will be executed. The output value will appear in the Preview window and the prints will appear in the Console Output.
- Click
Save - Now Conncet the output of the Transformation to the
MachineStateproperty of the SQL enterprise connector. - Click
Push Current Valueon theMachineStateProperty of theOPC UAfield connector to test.
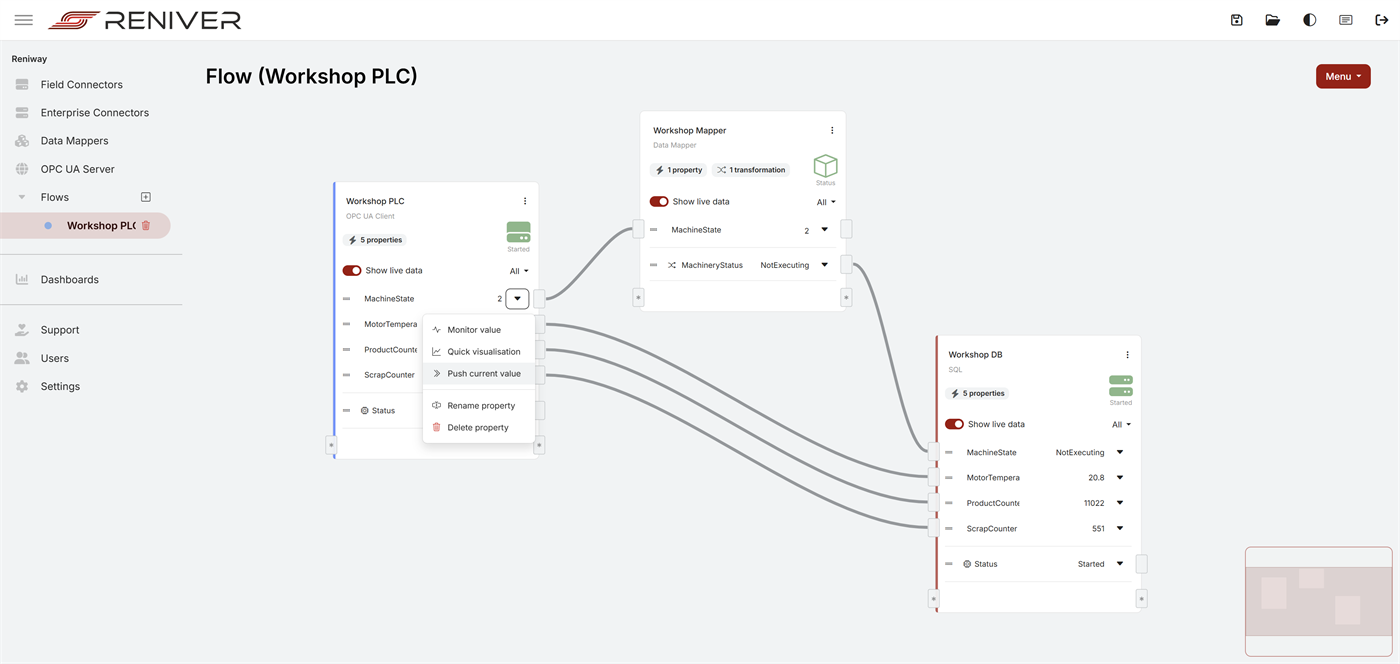
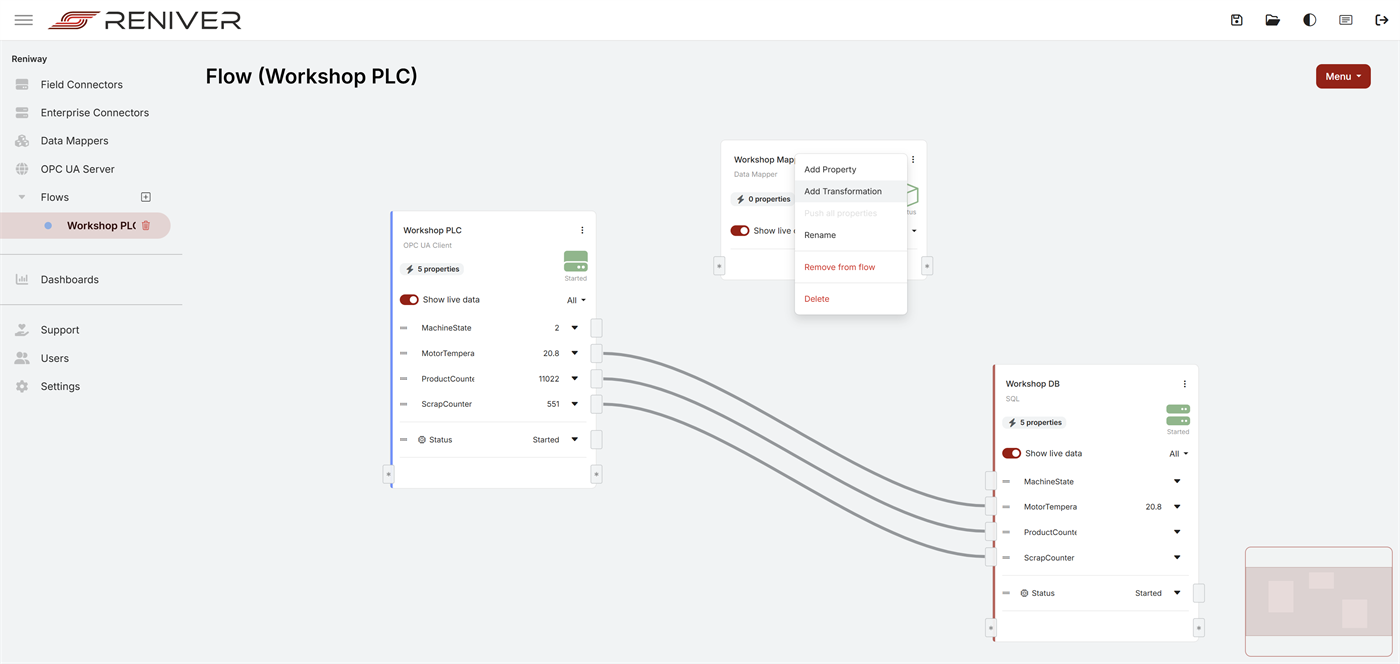
Result of This Step
After this step, your data path for the machine state should be:
Workshop PLC.MachineState --> Data Mapper transformation --> Workshop DB.MachineState
Your flow should now look similar to this:
Step 12 — Verify That Data Is Arriving in PostgreSQL
Go back to DBGate and verify that rows are appearing in all four tables:
machinestateproductcounterscrapcountermotortemperature
A quick way to verify is to run:
SELECT * FROM machinestate ORDER BY "time" DESC LIMIT 10;
SELECT * FROM productcounter ORDER BY "time" DESC LIMIT 10;
SELECT * FROM scrapcounter ORDER BY "time" DESC LIMIT 10;
SELECT * FROM motortemperature ORDER BY "time" DESC LIMIT 10;
If no rows appear:
- check that the connector status is Started
- turn on Show live data
- use Test Query in the SQL property
- verify the correct database name and credentials
- confirm the PLC values are changing
Step 13 — Open Grafana
Open:
https://[EDGE-IP]/dashboards
Log in with:
- Username:
admin - Password:
admin
Add the PostgreSQL Data Source
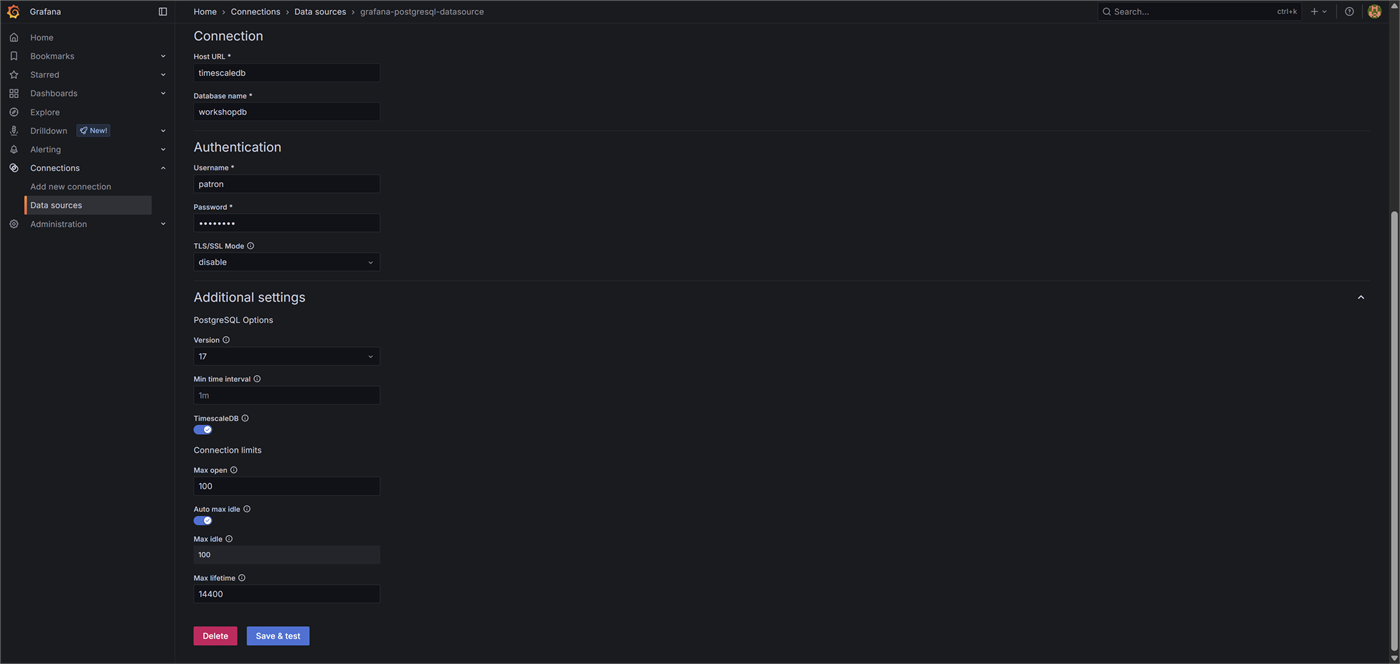
By clicking Datasources in the Grafana menu on the left, create a new PostgreSQL data source with the same database details you used in Reniway:
| Setting | Value |
|---|---|
| Name | workshopdb (default) |
| Host | timescaledb:5432 |
| Database | workshopdb |
| User | patron |
| Password | Ronpat10 |
| TLS/SSL Mode | disable |
Then:
- click Save & Test
Step 14 — Build the Dashboard Panels
Create a new dashboard and add the following panels.
Panel 1 — Machine State Timeline
Visualization: State timeline
Use this query:
SELECT "time", value
FROM machinestate
WHERE $__timeFilter("time")
ORDER BY "time";
Suggested panel title:
Machine State
Suggested value mappings / colors:
Executing-> greenNotExecuting-> yellowOutOfService-> redNotAvailable-> gray
Panel 2 — Product Counter
Visualization: Stat
Use this query:
SELECT value
FROM productcounter
WHERE $__timeFilter("time")
ORDER BY "time" DESC
LIMIT 1;
Suggested panel title:
Product Counter
Panel 3 — Scrap Counter
Visualization: Stat
Use this query:
SELECT value
FROM scrapcounter
WHERE $__timeFilter("time")
ORDER BY "time" DESC
LIMIT 1;
Suggested panel title:
Scrap Counter
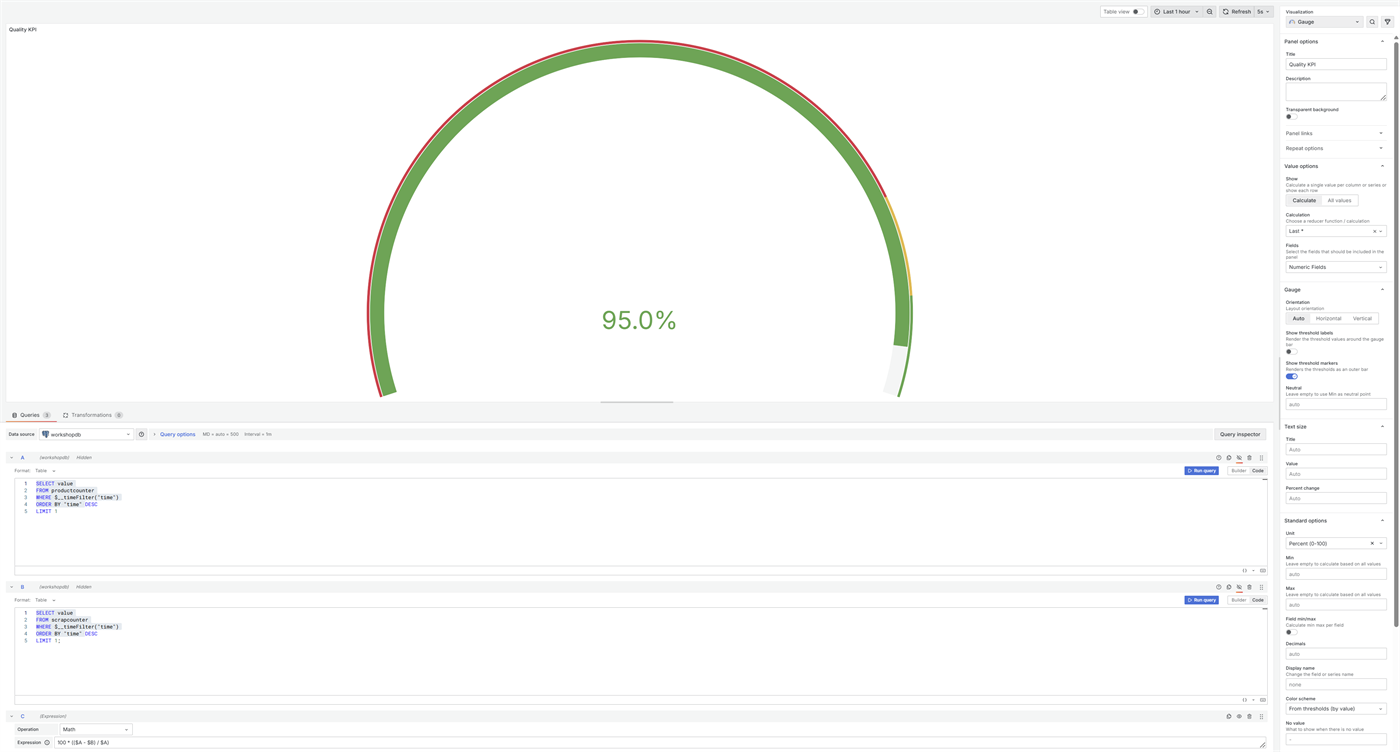
Panel 4 — Quality KPI
Visualization: Gauge
Because the product and scrap values are counters, build this KPI in Grafana by adding two queries and one expression in the same panel.
Query A
SELECT value
FROM productcounter
WHERE $__timeFilter("time")
ORDER BY "time" DESC
LIMIT 1;
Query B
SELECT value
FROM scrapcounter
WHERE $__timeFilter("time")
ORDER BY "time" DESC
LIMIT 1;
Expression C
100 * (($A - $B) / $A)
Suggested panel title:
Quality KPI
Suggested unit:
percent (0-100)
The panel configuration should look similar to this when the gauge, unit, and query/expression setup are in place:
Panel 5 — Motor Temperature
Visualization: Time series
Use this query:
SELECT "time", value
FROM motortemperature
WHERE $__timeFilter("time")
ORDER BY "time";
Suggested panel title:
Motor Temperature
Suggested unit:
temperature
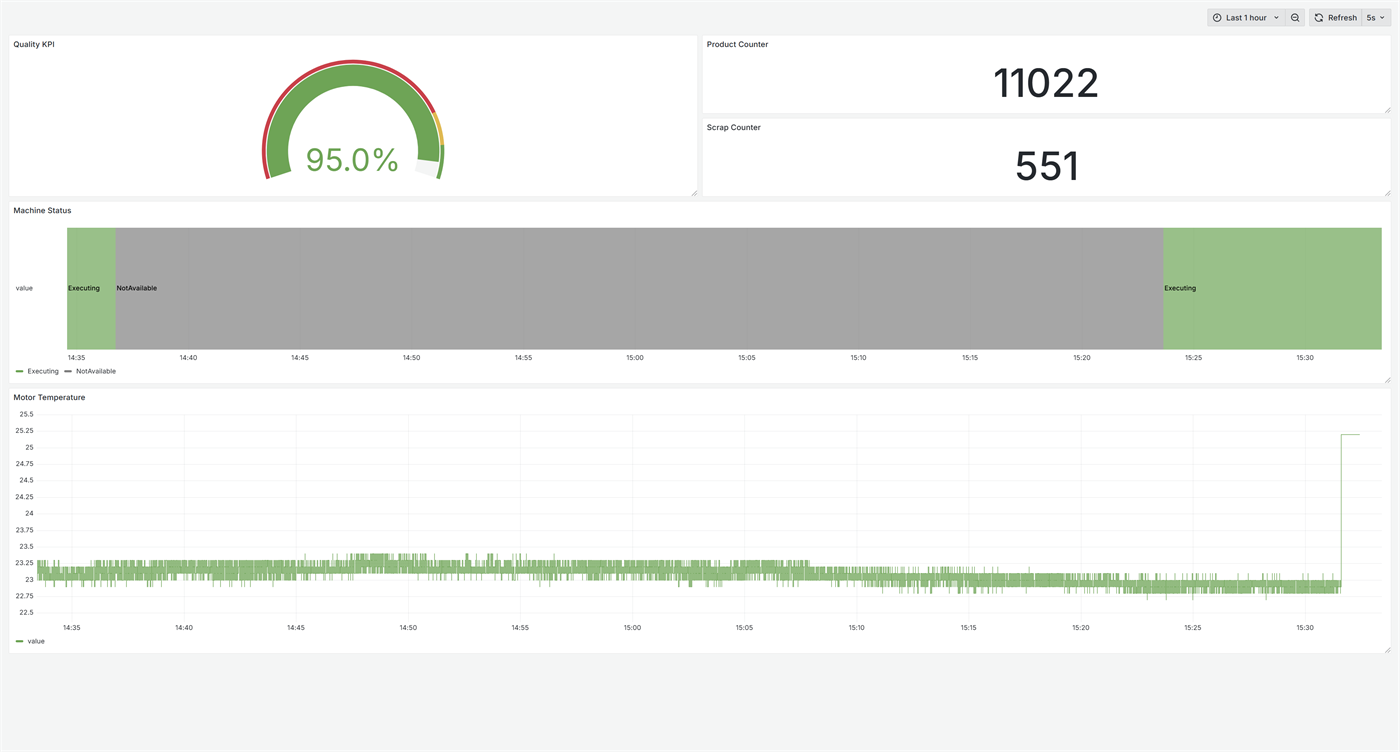
Once all panels are configured, your dashboard can look similar to this:
Step 15 — Final Check
Before you finish, make sure all of the following are true:
- the OPC UA field connector is Started
- the SQL enterprise connector is Started
- live data is visible in the flow
- all four PostgreSQL tables are receiving rows
- Grafana can query
workshopdb - your dashboard shows:
- machine state over time
- product count
- scrap count
- quality KPI
- motor temperature
Troubleshooting
I Cannot Connect to the PLC
- Verify the OPC UA endpoint:
opc.tcp://192.168.101.207:4840 - Make sure the connector uses Anonymous login for this workshop
- If certificates are involved, check Settings > Connectors > OPC UA Client > Auto Accept Certificates
I Can See Live PLC Data, but Nothing Reaches PostgreSQL
- Open the SQL connector property and use Test Query
- Check that the correct table name is used
- Check the parameter type of
@value - Confirm the database is
workshopdb
Grafana Says the Query Cannot Run
- Confirm the data source points to
workshopdb - Confirm the PostgreSQL data source is saved successfully
- Confirm the dashboard time range contains recent data
I Only See the First Login Screen
- Ask the instructor whether the system license has already been uploaded to the Edge device